Displaying 1 - 10 of 118
![Median day time Land Surface Temperature (LST) calculated using June – September 2016 – 2021 thermal imagery from Landsat 8 TIRS. Displayed is the city of Yonkers, located in Westchester County, directly north of the Bronx in New York City and right of the Hudson River. Shades of yellow–red indicate high LST. Green–teal shades indicate cooler LST. Solid purple represents water bodies. Focusing on yellow-red areas allows the city of Yonkers to prioritize heat mitigation strategies.](/sites/default/files/styles/lis/public/2022-03/2021Fall_AZ_YonkersUrbanII_WebsiteImage_1440.png.webp?itok=l-QdbVsl)
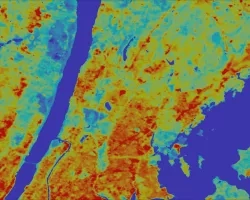
Yonkers Urban Development II (Fall 2021) Team: Tamara Barbakova (Project Lead), Akshay Agrawal, Amanda Trakas, Kyle Pecsok, and Lauren Mahoney Summary: The City of Yonkers...
![This image depicts chlorophyll-a concentrations along the Southern California Coast during a Harmful Algae Bloom, also known as a Red Tide Event. The ocean imagery was taken in April of 2020 by Aqua MODIS and used to generate chlorophyll-a concentration. The land imagery was taken by Sentinel-2 MSI during the same time period, and a Normalized Difference Chlorophyll Index was applied to it for visualization purposes. Blue and green indicates high and low chlorophyll-a concentrations, respectively. On land,](/sites/default/files/styles/lis/public/2022-05/2021Fall_ARC_SoCalHAQ_WebImage.png.webp?itok=1m8SL35K)
Southern California Health & Air Quality (Fall 2021) Team: Michael Enz (Project Lead), Melanie Leung, Maya Zimmerman, Jonathan Van Dermark, and Petra Nichols Summary: In...
![Normalized Difference Moisture Index (NDMI) processed 2021 Landsat 8 OLI imagery over land and Sentinel-2 MSI over ocean, ranging from yellow (low) to blue (high), for Hilo, Hawaii. Overlayed with four-day rainfall accumulation cells in blue acquired during Hurricane Lane (Aug 22-25, 2018) from CHIRPS Daily. NDMI monitors water content of leaves and is useful for classifying land cover. Impervious surfaces and areas that have received excessive historical rainfall are susceptible to future flood events.](/sites/default/files/styles/lis/public/2022-03/2021Fall_AZ_HawaiiIslandDisasters_WebsiteImage_1440.png.webp?itok=UF3NMIoI)
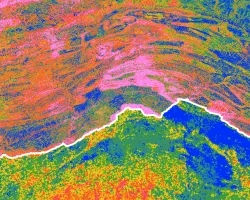
Hawai‘i Island Disasters (Fall 2021) Team: Garren Kalter (Project Lead), Rose Eichelmann, Sanketa Kadam, Erin Azuma, and Anna Mikkelsen Summary: As the County of Hawai‘i...
![In September 2020, the Mullen fire burned 176,000 Acres in Medicine-bow National Forest, WY. Sentinel-2 true color imagery with a difference normalized burn ratio from June 2021 shows different levels of burn severity (left). Black indicates areas of high severity, while grey represents lower severity. A NASA SRTM digital elevation model and cartographic elevation map overlays a post-fire cheatgrass detection layer (right).](/sites/default/files/styles/lis/public/2022-03/2021Fall_CO_SouthernWyomingEco_WebsiteImage.png.webp?itok=ttZDklwG)
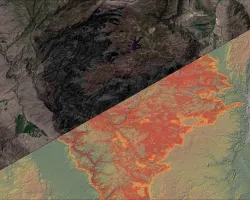
Southern Wyoming Ecological Forecasting (Fall 2021) Team: Dahlia Shahin (Project Lead), Emily Snyder, Kyle Paulekas, Michael Segala, and Sanju Khatri Summary: Cheatgrass (Bromus tectorum) is a prominent...
![Models of two invasive plant species in the Northeast US. Established invasive Microstegium vimineum (top) modeled with high-resolution, US-specific data, and new arrival Oplismenus undulatifolius (bottom) modeled with widely accessible, low-resolution data. Probability of species presence ranges from low (blue) to high (pink). The Appalachian Trail (white), an important vector of non-native plant invasion, crosses this region northwest of Washington, DC. Predictive environmental data (1980-2021) acquired f](/sites/default/files/styles/lis/public/2022-03/2021Fall_CO_NortheastEco_Website_Image.png.webp?itok=AiHdmtzT)
Northeast US Ecological Forecasting (Fall 2021) Team: Rebecca Ohman (Project Lead), Chloe Birney, Anthony Bowman, Scarlet Jackson, and Margaret Jaenicke Summary: Invasive plant species threaten...
![Satellite image showing Venus flytrap habitat in coastal North Carolina. NDVI, derived from Landsat 8 OLI/TIRS sensors from April – July 2021, measures health and density of vegetation. Orange and red represent low and high burn severity, respectively, whereas pink and green represent low and high NDVI. The DEVELOP team used NDVI and fire severity data as input for Venus flytrap habitat suitability models, which botanists can use to support the conservation of Venus flytrap.](/sites/default/files/styles/lis/public/2022-03/2021Fall_GA_CCPEco_WebsiteImage.png.webp?itok=PUDex4jB)
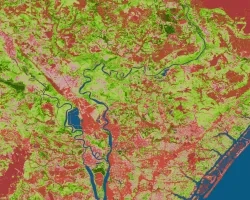
Carolina Coastal Plain Ecological Forecasting (Fall 2021) Team: Monika Rock (Project Lead), Katie Caruso, Jayne Lampley, Ashna Siddhi, Seamore Zhu, and Summary: Although the carnivorous...
![Temperature anomalies for 2020 were derived from Terra MODIS Daily Land Surface Temperature (LST) data and compared to the 20-year average (2000 – 2020) in Maine. Shown is an enlarged subset of Maine. Stream vectors are represented in light blue. Blue pixels represent decreases in LST (cooler temperatures), green pixels represent areas of neutral change (average temperatures), while red and yellow pixels represent increases in LST (the highest temperatures).](/sites/default/files/styles/lis/public/2022-03/2021Fall_GSFC_MaineEco_WebsiteImage.jpg.webp?itok=9Ej487B3)
Maine Ecological Forecasting (Fall 2021) Team: Michael Corley (Project Lead), Philip Casey, Olivia Landry, Lily Oliver, and Brian Varley Summary: Atlantic salmon (Salmo salar) is...
![Results of habitat suitability for mustelids in Western Montana, derived from mean PRISM temperature and precipitation (2010-2020), NASA SMAP soil moisture (2015-2020), HydroSHEDS river width and depth, NLCD 2016 Land Use Land Cover, NASA ALOS SRTM elevation, as well as species presence points for mink and otter (2000-2021). Yellow, red and violet areas represent high, medium, and low habitat suitability respectively. Yellow area is prime surveying location for mustelid species.](/sites/default/files/styles/lis/public/2022-03/2021Fall_GSFC_WesternMontanaEcoII_WebsiteImage.png.webp?itok=lR_GDQpk)
Western Montana Ecological Forecasting II (Fall 2021) Team: Chelsea Morton (Project Lead), Amanda Bosserman, Caden O’Connell, and Rylee Tomey Summary: Environmental contaminants in aquatic ecosystems...
![Potential for land cover to change from trees to grass, forb, and herb between 1987 and 2020 in the Teton Mountain Range. Image created from LCMS land cover data which are derived from Landsat 4, 5, 7, and 8 imagery (1987 - 2020). High transition potential is depicted in yellow and low transition potential is indigo. Transition potentials help to forecast land cover and inform land managers on the locations of suitable bighorn sheep habitat.](/sites/default/files/styles/lis/public/2022-03/2021Fall_ID_GrandTetonEco_WebsiteImage.png.webp?itok=q05PkvLT)
Grand Teton Ecological Forecasting (Fall 2021) Team: Alex Posen (Project Lead), Allyson Earl, Sarah Hettema, and Michael Hitchner Summary: Grand Teton National Park provides habitat...
![An NDWI waterbody mask derived from Landsat-8 OLI cloud-masked imagery from March-May 2019-2021 is shown in blue at 10-meter resolution over Mexico, Belize, and Guatemala. The ALOS-PALSAR-2 fine-beam L-band false color composite includes Refined Lee speckle filtered HV, HH, HH/HV bands. Darker and brighter green hues represent to low and high backscatter, respectively. Differentiating between open water, like the Hondo River, from vegetated inundation is important when distinguishing inundation by land cove](/sites/default/files/styles/lis/public/2022-03/2021Fall_JPL_MayaForestWaterResourcesII_WebsiteImage.png.webp?itok=WSwTB7q7)
Maya Forest Water Resources II (Fall 2021) Team: Stephanie Jiménez (Project Lead), Karen Alvarez, Rene Castillo, Daniel Nohren, and Stephanie Lawlor Summary: To monitor seasonal...