Principal Investigator

Paxton LaJoie

Imagen
Median summer daytime land surface temperature (LST) imagery displaying Cincinnati, Ohio and Northern Kenton County, Kentucky using Landsat 8 OLI data from June – August of 2019 – 2020. LST was derived from the median NDVI, brightness temperature, emissivity, and thermal band. Lighter shades of yellow indicate lower median LST, whereas darker shades of brown indicate higher median LST. Areas of higher LST should be prioritized for heat mitigation efforts.  Keywords: urban heat island, land surface temperature

The Urban Heat Island (UHI) effect is a phenomenon characterized by urban areas experiencing temperatures that are, on average, warmer than surrounding suburban and rural regions. UHIs are fueled by expansive impervious surfaces, vehicle emissions, and insufficient urban green space...

Principal Investigator

Stephanie Kealy

Imagen
This image includes a false color composite of Landsat 5 TM imagery (August 8 to 16, 2011), high-resolution classified imagery from the City of Hampton (January 2018), and percent tree canopy cover from regression analysis for the Hampton Roads peninsula in Virginia. The yellow represents high tree canopy cover (80 to 100%) and the dark purple represents low cover (0 to 10%). Percent tree canopy cover allows for the City to visualize areas for improvement.

Hampton Roads’ 1.6 million residents thrive on bustling military, harbor, and environmental industries. The region’s stakeholders identified an increasing flood and water quality risk due to urbanization, a changing climate, and sea-level rise. These hazards threaten not only the livelihood...

Principal Investigator

Jacob Ramthun

Imagen
Assessing Vegetation and Precipitation Indices to Aid Bighorn Sheep Habitat Monitoring and Management

Desert bighorn sheep (Ovis canadensis; BHS) habitat selection is influenced by the relationship between precipitation patterns and habitat vegetation availability. The ability to effectively measure habitat resource quality and availability, and understand mortality rates caused by disease and predation is needed to enhance BHS habitat...

Principal Investigator

Adelaide Schmidt

Imagen
6 month Standard Precipitation Index (SPI) derived from GPM-IMERG. This shows the areas of drought for July of 2018 in the dry corridor of Central America. The dark red is extreme drought conditions, while as it gets more towards yellow it becomes mild drought.  Keywords: SPI, GPM IMERG, Precipitation

The dry corridor resides primarily in the pacific region of Central America, which experiences severe drought during the El Niño Southern Oscillation cycle. El Niño causes severe climate variances in Central America that impact agriculture, livelihoods, and hydrological cycles. The...

Principal Investigator

Danielle Quick

 
Imagen
Assessing Water Clarity to Identify Potential Areas of Submerged Aquatic Vegetation (SAV) in the Chesapeake Bay

Submerged Aquatic Vegetation (SAV) is vitally important to the Chesapeake Bay, serving as one of the primary food sources for the organisms that inhabit the Bay. This project evaluated the efficacy of remote sensing applications as a tool to monitor water quality parameters, specifically...

Principal Investigator

Kathrene Garcia

Imagen
Assessing Water Quality in Thailand's Chao Phraya Watershed through Modeling Sediment Concentration and Urban Footprint

The Chao Phraya River and surrounding watershed has seen an extensive increase in urban development in the last century, while simultaneously experiencing significant degradation in water quality. Covering 30% of Thailand, the Chao Phraya watershed encompasses rural areas and major metropolitan centers, including Bangkok. The...

Principal Investigator

Annemarie Peacock

Imagen
Automated Wetland Hydroperiod Mapping by Integrating Optical Satellite Imagery and Synthetic Aperture Radar

Alaska’s wetlands cover approximately one third of the state and provide a multitude of ecosystem services, including nutrient retention, water purification, and provision of habitat for fish, wildlife, and vegetation. The temporal variation in wetland inundation affects these ecosystem functions, and for effective wetland policy...

Principal Investigator

Erika Munshi

Imagen
At the base, Landsat 8 OLI displays an 8-day NDWI composite using 2020 imagery in false color; light hues represent higher presence of water. Howard County slope displayed in black and white; white values indicate steep areas and emphasize water transport efficiency in Ellicott City, MD (center) joining the Patapsco River. NASA Daymet precipitation from May 2018 flash flood event displayed in rainbow; purple hues represent severe rainfall on right of image as storm recedes.   Keywords: precipitation, hydrology, forecast, early warning system, disaster preparedness​

As flood events in the United States grow in frequency and intensity, the uses of applied remote sensing analyses are increasingly necessary for effective flood monitoring and warning systems. The NASA DEVELOP Ellicott City Disasters III project investigated the use...

Principal Investigator

M. Colin Marvin

Imagen
Nearshore turbidity created with 2020 Landsat 8 OLI red band (B3). Assateague Island, our study site, is located off the coast of Virginia and Maryland. Red shades suggest high turbidity, light green and yellow shades suggest moderate turbidity and blue and purple shades show low turbidity. Knowing the extent of turbidity allows the team to examine how natural longshore currents are moving sediment deposited by the US Army Corps of Engineers. This is important for both the geological integrity of the island and threatened species depend on sediment replenishment.  Keywords: Turbidity, ORCAA, ocean color, bathymetry, sediment transport

Assateague Island is located off the coast of Maryland and Virginia and serves as a home to sensitive species and habitats. However, infrastructure development disrupted the natural sediment transport processes of the barrier island, which accelerated erosion of the island’s...

Principal Investigator

Brandon Crawford

Imagen
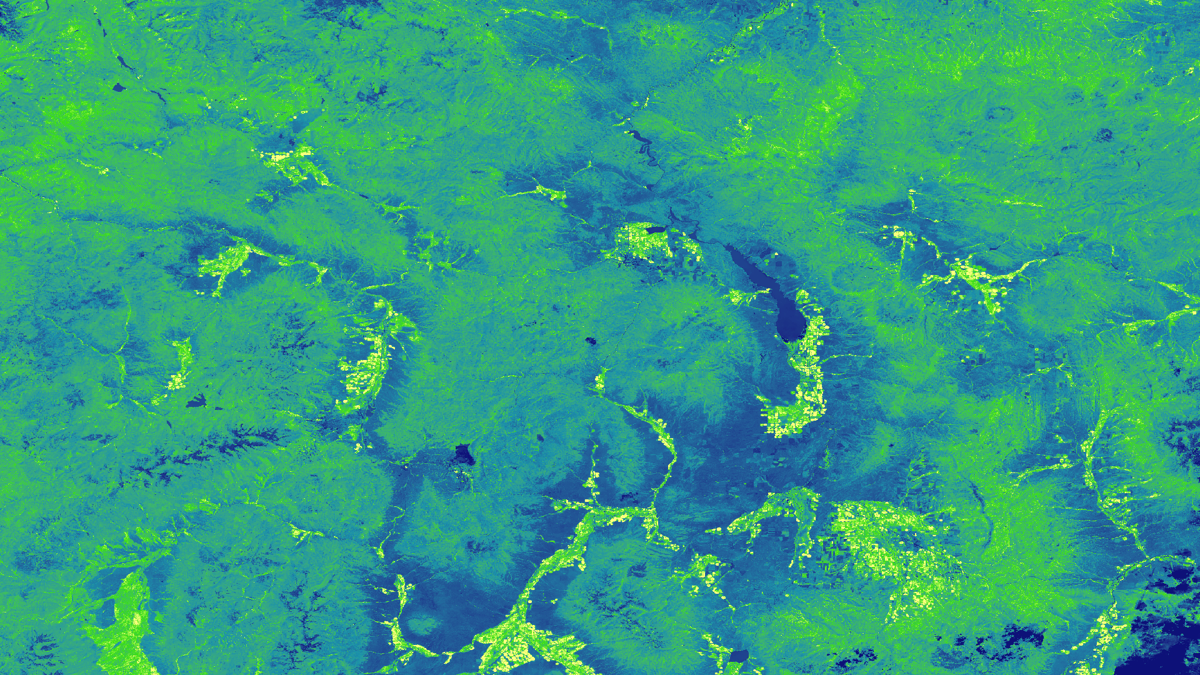
Characterizing Vegetation Type at Pre- and Post-wildfire Periods Using NASA Earth Observations

Wildfire is a key driver of ecosystem progression in the sagebrush steppe-dominated landscapes of southern Idaho. Fire-related disturbances can facilitate the propagation of invasive vegetation, threatening native wildlife and shaping a fire regime that is increasingly hazardous to adjacent urban development. Applying the methodology created...