Forecasters predicted an above-normal hurricane season for 2020. They weren’t wrong.
As the 2020 Atlantic hurricane season smashed records with an unprecedented 30 named storms, NASA’s Earth Applied Sciences Disasters Program stood up to the challenge. The Disasters Program helps leaders and responders at national, regional, and local levels leverage NASA’s technology and expertise to assess, predict, and understand disasters' impacts. The Disasters Program targets a wide range of hazards and disasters, and while NASA is not an operational response agency, the agency offers access to unique resources, relationships, and scientific expertise to those who use it on the ground.
The Atlantic hurricane season, which officially ran from June 1 to Nov. 30, marked the fifth year in a row with above-average hurricane activity. The National Weather Service noted that every mile of the U.S. Atlantic coast was under a tropical watch or warning in 2020. NOAA reported the most billion-dollar disasters in the U.S. in a single year in the 40 years that they have kept track, which hurricanes contributed significantly to. Of twelve named storm systems that made landfall in the continental U.S. in 2020, seven (Hanna, Isaias, Laura, Sally, Delta, Zeta and Eta) each caused over $1 billion in overall damage costs.
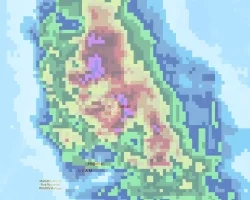
This visualization shows the hurricanes and tropical storms of 2020 as seen by NASA’s Integrated Multi-satellitE Retrievals for GPM (IMERG) - a data product combining precipitation observations from infrared and microwave satellite sensors united by the GPM Core Observatory. IMERG rain rates (in mm/hr) are overlaid on infrared cloud data from the NOAA Climate Prediction Center (CPC) Cloud Composite dataset together with storm tracks from the NOAA National Hurricane Center (NHC) Automated Tropical Cyclone Forecasting (ATCF) model. Sea surface temperatures (SST) are also shown over the oceans, derived from the NASA Multi-sensor Ultra-high Resolution (MUR) dataset, which combines data from multiple geostationary and orbiting satellites. Sea surface temperatures play an important role in hurricane formation and development, with warmer temperatures linked to more intense storms. Credits: NASA Goddard Scientific Visualization Studio
Tropical storms and hurricanes were also more active and intense later in the year than usual. “Countries that experience hurricanes are used to that season peaking between July to September,” remarks Ronan Lucey, a researcher at the University of Alabama in Huntsville, working within NASA’s Disasters Program. “This was a long season, and we have to look at the climatic conditions that lead to that.”
Looking Out for Louisiana
The southern coast of the U.S. certainly saw its share of storms. Late October marked the fifth time a named tropical storm or hurricane made landfall in Louisiana in 2020, as Hurricane Zeta followed Hurricanes Delta and Laura and Tropical Storms Marco and Cristobal to deluge the state. Hurricane Sally also headed for Louisiana before tracking northeast to make landfall nearby at Gulf Shores, Alabama. Laura, a Category 4 hurricane, was the strongest storm in the series, causing an estimated $19 billion in damage along the coast and inland to the city of Lake Charles. Six weeks later, Hurricane Delta struck as a Category 2 hurricane – just 15 miles from where Laura made landfall.
For Hurricanes Laura, Sally, and Delta, the Disasters Program activated to collaborate closely with stakeholders from the Federal Emergency Management Agency (FEMA), the Louisiana National Guard, and the Alabama Emergency Management Agency, among others. NASA Disaster coordinators provided guidance and shared expert analysis in meetings and through data distributed on the NASA Disasters Mapping Portal.

The Disasters Mapping Portal serves as the entry point and hub for near real-time (NRT) and event-specific data products made available by NASA scientists and collaborators supporting the Disasters Program. The Portal makes it easier for regional agencies directly affected by storms to view and analyze cutting-edge Earth-observing data, which aids decision-making and response. Multiple datasets can be combined and overlaid in unique ways, allowing researchers to gain insights into the complex interactions between Earth’s systems - like the relationship between soil moisture and flood extent, or sea surface temperature and storm intensification. Satellite observations are also often combined with population and infrastructure data to identify vulnerable communities and lifelines, and to make effective decisions for resource allocation. The Portal also allows users to download the data in a standardized Geographic Information Systems (GIS) format to use in their own analysis tools.
Repeat hurricanes can potentially compound risk to impacted areas as rain-saturated ground increases the chances of flooding and landslides. Recognizing this, the Disasters Program provides access to extensive research and tools that can aid local emergency personnel with analysis, response, and recovery of such cascading hazards.
Access to this research and information is especially important for regions of the world that are particularly exposed and vulnerable to hurricanes. Rapid political and economic changes in some areas of the world can also bring challenges to the coordination and informational awareness that would normally help decision-makers safeguard their communities. That’s one reason the Disasters Program participates and serves in leadership roles in associations such as AmeriGEO, an organization that promotes collaboration and coordination for risk reduction in the Americas.
Delivering Central America Data on the Double
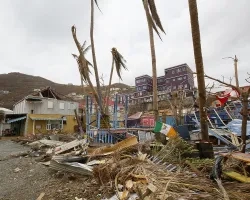
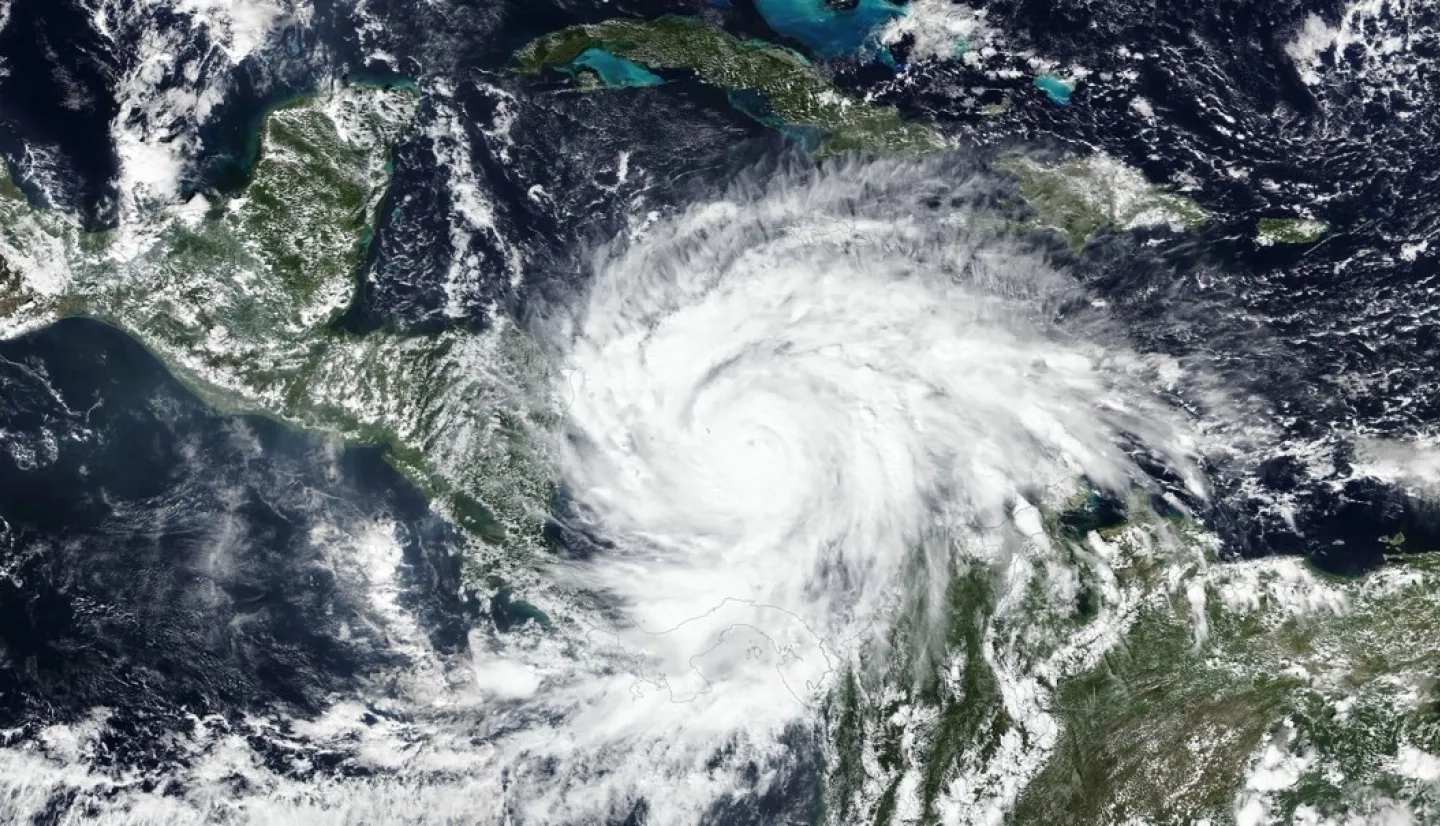
Before 2020, Nicaragua had only recorded two Category 4 or higher hurricanes hitting their shores. In November, two storms, Eta and Iota, struck the country within 15 miles of each other – and just two weeks apart. Two Category 4 hurricanes landing this close together hadn’t been reported in nearly 170 years of records. When those hurricanes hit Central America, they brought deadly flooding and landslides throughout the region, including Honduras and Guatemala. With response teams already stretched, information that helps officials make timely and accurate decisions becomes even more critical.
“NASA data, models and expertise are an important asset that organizations in the Americas have at the international, national, regional and local levels for decision-making when disasters happen,” says Ricardo Quiroga a Disasters Program coordinator, researcher at NASA’s Langley Research Center, and co-founder of AmeriGEO. “That’s why it is so important to develop and maintain active relationships–so useful information can quickly flow to the levels where it has the most positive impact.” Quiroga leads a team working on several different projects intended to benefit the response, resilience and recovery processes of Central and South American, and Caribbean countries in the long term, including the implementation of a multi-hazard assessment in Central America.

Collaborations Lay the Groundwork for Work on the Ground
By laying the groundwork and nurturing connections in the Americas before Eta and Iota hit, NASA’s Disasters Program was able to quickly organize to help regional and local officials and responders not only anticipate the initial impact of both historic storms, but also comprehend the effects of the flooding and landslides that came with the “one-two punch” of the historic storms. The Program worked with the World Bank and SERVIR to collaborate at a regional level, supporting response efforts of the Guatemalan Coordinating Agency for Disaster Reduction (CONRED) and the Coordination Center for the Prevention of Natural Disasters in Central America (CEPREDENAC). Stakeholders in Nicaragua, Honduras and Guatemala, El Salvador, Belize, Costa Rica, and Panama used NASA resources to help confront such topics as the extent of flooding in the region, situational awareness for potential landslides, and more. Support from the Disasters Program included damage assessment, debris management considerations, analysis of river containment systems, and land use / land cover mapping.
The Disasters Program also collaborated with U.S. Southern Command (SOUTHCOM) and provided Damage Proxy Maps and other data products to support flood assessment and recovery efforts for emergency humanitarian assistance and disaster relief planning.

During the hurricane response for Iota, SOUTHCOM utilized the flood extent layers provided by NASA in their Common Tactical Picture hosted on Cerebrum, their own GIS data portal. The information was continuously displayed on the operations floor and was referenced during mission update briefings, and by forward-deployed units based out of the Joint Task Force. SOUTHCOM used the map layers to inform decisions such as when they could access specific delivery port for supplies and timing for deploying airfield assessment teams.
Researchers are also improving processing methods and the use of different datasets by working with NASA scientists toward developing algorithms for Google Earth Engine – a platform with massive computing power that can speed Earth data processing. “We have been working with NASA for almost a year now through our working group,” notes Louis Heying, who leads a team tackling this challenge at National Geospatial-Intelligence Agency (NGA) Headquarters. “The goal is that we can incorporate the scientific principles from their methods into our methods so that the way we produce data is similar. We have recently received their data from the hurricanes and are looking to compare it with our flood extents.”
Matching Needs in a Matchless Year
As the ever-present threat of the COVID-19 pandemic made response and recovery efforts for teams on the ground riskier in 2020, a key priority for NASA has been to make data more discoverable and accessible to people around the world in ways that make it most useful.
“When I think of the 2020 hurricane season, the variety of different needs that organizations had and how wide of an interest the Disasters Program generates really stands out to me,” says Lucey. Lori Schultz, a remote-sensing scientist with the University of Alabama who also serves as a center coordinator for the Disasters Program at NASA’s Marshall Space Flight Center, agrees, “The research we do and the work we’ve done with the GIS (Geographic Information Systems) Team has been astronomical in helping to put NASA science data, which historically is not very ‘user-friendly,’ into various formats that can be used and accessed quickly.” Lucey concludes, “Different organizations have different needs, and for us to be able to respond well to those needs, particularly with these repeated events such as in Central America during this incredible hurricane season, was a highlight.”
Learn More
Related Applied Research Projects
- Advancing Access to Global Flood Modeling and Alerting using the PDC DisasterAWARE Platform and Remote Sensing Technologies
- Global Rapid Damage Mapping System with Spaceborne SAR Data
- Integrating SAR Data for Improved Resilience and Response to Weather-Related Disasters
- Developing global building exposure for disaster forecasting, mitigation, and response
NASA Hurricanes & Cyclones Resources