Displaying 71 - 80 of 125
![Aqua MODIS-derived nighttime land surface temperature climate normal for 2002–2022 across the southeastern portion of Organ Pipe Cactus National Monument. Shades of green and blue indicate lower mean nighttime temperatures while shades of orange and red indicate higher temperatures. Tinajas in areas with higher (red) nighttime temperatures are at risk of drying out. This data will help park managers prioritize conservation in identified areas as warming and drying trends continue across the western Sonoran](/sites/default/files/styles/lis/public/2022-11/2022Sum_NC_WesternSonoranDesertWater_WebsiteImage.jpg.webp?itok=Y6HvO1u9)
Western Sonoran Water Resources (Summer 2022) Team: Anne Britton (Project Lead), Deirdre An, Seamus Geraty, Charles Nixon Summary: Ephemeral freshwater rock pools, known as tinajas...
![2010 – 2021 NDWI-processed imagery of the greater Kansas City, Kansas region. This image combines Landsat 5, 7, and 8 highlighting dry areas in yellow through orange. Areas classified as water are identifiable in aqua blue. Areas of darker blue are considered wet but include cityscape. A major problem for urban flooding identification is the mixture of cityscape in wet areas, making it important for further investigation and data processing.](/sites/default/files/styles/lis/public/2022-11/2022Sum_MA_KansasCityDisasters_WebsiteImage.jpg.webp?itok=WCOEqekJ)
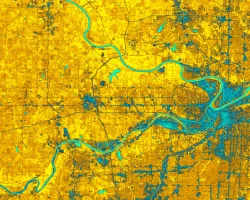
Kansas City Disasters (Summer 2022) Team: M. René Castillo, Hadwynne Gross, Eric Sjöstedt, Raychell Velez Summary: Pluvial flooding, over-saturated ground, and poor drainage systems disproportionately...
![NDWI-processed image derived from Landsat 7 ETM+ data captures the aftermath of a 3-inch rainstorm in Milwaukee, Wisconsin. The composite image shows inundated areas in blue and dried areas in orange a few days after an April 2015 storm. Satellite imagery used in conjunction with hydrological models allow the city to identify areas in need of flood mitigation strategies.](/sites/default/files/styles/lis/public/2022-11/2022Sum_VEJ_MilwaukeeUrban_WebsiteImage_v2_final.jpg.webp?itok=Gyny1SDX)
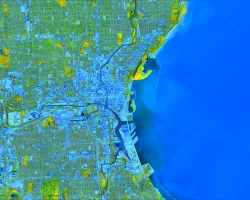
Milwaukee Urban Development (Summer 2022) Team: Madeleine Tango (Project Lead), Jack Acomb, Lisa Son, Annika Harrington Summary: Milwaukee County has experienced an increase in flooding...
![NDVI-processed imagery from Landsat 8 OLI data. This composite image of Wichita, KS, was created using 2018–2022 summer imagery. Lighter shades of yellow indicate limited vegetation in built-up areas and bodies of water, while darker shades of purple indicate dense vegetation. Understanding the spatial distribution of vegetation, such as tree canopy, is essential to recognizing and mitigating heat risk, and prioritizing intervention.](/sites/default/files/styles/lis/public/2022-11/2022Sum_VEJ_WichitaClimate_WebsiteImage.jpg.webp?itok=1WmU74Wp)
Topic
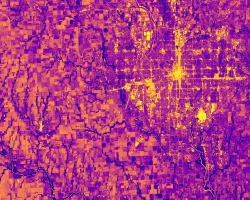
Wichita Climate (Summer 2022) Team: Brooke Laird (Project Lead), Melissa Ashbaugh, Muskaan Khemani, Sadie Murray Summary: Wichita, Kansas is facing a host of climate threats...
![Summer 2022 Albuquerque Urban Development](/sites/default/files/styles/lis/public/2022-11/2022Sum_AZ_ABQUrban_WebsiteImage.jpeg.webp?itok=LRwbaWtz)
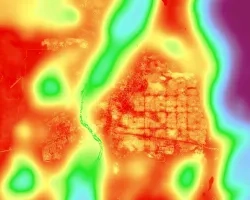
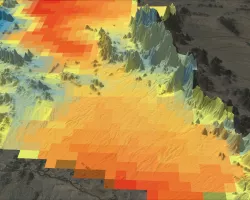
Albuquerque Urban Development (Summer 2022) Team: Max Stewart, Christina Dennis, Ritisha Ghosh, Richard Kirschner, Steven Nystrom Summary: The City of Albuquerque, New Mexico, is experiencing...
![Summer 2022 Yampa Water Resources](/sites/default/files/styles/lis/public/2022-11/2022Sum_CO_YampaWater_WebsiteImage.jpg.webp?itok=1omwELNy)
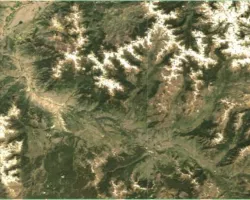
Yampa Water Resources (Summer 2022) Team: Samrin Sauda (Project Lead), Ethan Gates, Erin Weitzel, Morgan Guttman Summary: The Upper Yampa River Watershed (UYRW), located in...
![Summer 2022 Puget Sound Water Resources](/sites/default/files/styles/lis/public/2022-11/2022Sum_CO_PugetSoundWater_WebsiteImage_V2.jpg.webp?itok=mMOCVh-6)
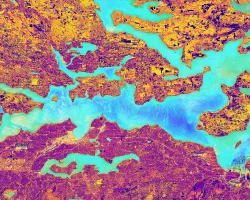
Puget Sound Water Resources (Summer 2022) Team: Mike Hitchner (Project Lead), Lily Oliver, Sofia Fall, Lyndsay Zemanek Summary: Bull kelp (Nereocystis luetkeana) is a critical...
![Summer 2022 Yellowstone Ecological Forecasting](/sites/default/files/styles/lis/public/2022-11/2022Sum_GA_YellowstoneEcoForecasting_WebsiteImage.jpg.webp?itok=bjoTXDET)
Yellowstone Ecological Forecasting (Summer 2022) Team: Kyle Steen (Project Lead), Vanessa Bailey, Gabriella Boodhoo, Barry McLaughlin Summary: The removal and reintroduction of the gray wolf...
![Summer 2022 Chesapeake Bay Agriculture](/sites/default/files/styles/lis/public/2022-11/2022Sum_GFSC_ChesapeakeAg_WebImage_V2.jpg.webp?itok=oalM5vib)
Chesapeake Bay Agriculture (Summer 2022) Team: Alexia Hernandez (Project Lead), Clay Hays, Arina Morozova, Matthew Borden Summary: The Chesapeake Bay boasts some of the nation’s...
![Vegetation productivity decline calculated from the yearly maximum NDVI for 1986–2021, derived from Landsat 5/7/8 data, and overlaid on a 2021 Landcover Change Monitoring System composite, constructed from Landsat 8 OLI. Blue, purple, and pink represent grasses & forbs, shrubs, and trees respectively. Red over pink likely indicates beetle and drought disturbance. Data can be used to inform management and prepare public land for ecological change in the Grand Valley region of Colorado.](/sites/default/files/styles/lis/public/2022-11/2022Sum_ID_GrandValleyEcoII_WebsiteImage_V2.jpg.webp?itok=I4kX7CdG)
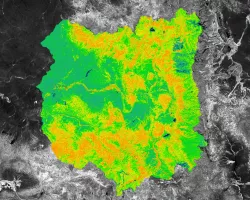
Grand Valley Ecological Forecasting II (Summer 2022) Team: Bill Curtiss (Project Lead), Aliza White, Sam Majumder, Rhea Martinez Summary: Disturbances and landcover change in pinyon-juniper...