Displaying 361 - 370 of 466
![Summer 2022 Yampa Water Resources](/sites/default/files/styles/lis/public/2022-11/2022Sum_CO_YampaWater_WebsiteImage.jpg.webp?itok=1omwELNy)
Yampa Water Resources (Summer 2022) Team: Samrin Sauda (Project Lead), Ethan Gates, Erin Weitzel, Morgan Guttman Summary: The Upper Yampa River Watershed (UYRW), located in...
![Summer 2022 Puget Sound Water Resources](/sites/default/files/styles/lis/public/2022-11/2022Sum_CO_PugetSoundWater_WebsiteImage_V2.jpg.webp?itok=mMOCVh-6)
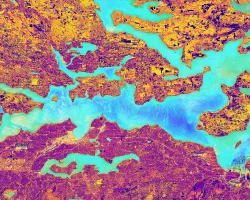
Puget Sound Water Resources (Summer 2022) Team: Mike Hitchner (Project Lead), Lily Oliver, Sofia Fall, Lyndsay Zemanek Summary: Bull kelp (Nereocystis luetkeana) is a critical...
![Summer 2022 Haiti Agriculture II](/sites/default/files/styles/lis/public/2022-11/2022Sum_GA_HaitiAgII_WebsiteImage.jpg.webp?itok=6JVFyy8M)
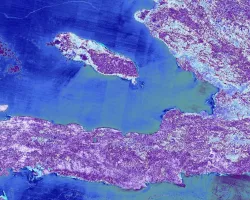
Haiti Agriculture II (Summer 2022) Team: Kelli Roberts (Project Lead), Justin Meyer, Rajneesh Sharma, Monique Howlett Summary: The Caribbean country of Haiti has an extensive...
![Summer 2022 Yellowstone Ecological Forecasting](/sites/default/files/styles/lis/public/2022-11/2022Sum_GA_YellowstoneEcoForecasting_WebsiteImage.jpg.webp?itok=bjoTXDET)
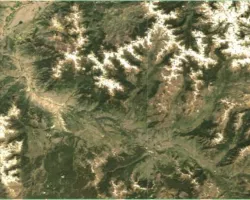
Yellowstone Ecological Forecasting (Summer 2022) Team: Kyle Steen (Project Lead), Vanessa Bailey, Gabriella Boodhoo, Barry McLaughlin Summary: The removal and reintroduction of the gray wolf...
![Summer 2022 Chesapeake Bay Agriculture](/sites/default/files/styles/lis/public/2022-11/2022Sum_GFSC_ChesapeakeAg_WebImage_V2.jpg.webp?itok=oalM5vib)
Chesapeake Bay Agriculture (Summer 2022) Team: Alexia Hernandez (Project Lead), Clay Hays, Arina Morozova, Matthew Borden Summary: The Chesapeake Bay boasts some of the nation’s...
![Vegetation productivity decline calculated from the yearly maximum NDVI for 1986–2021, derived from Landsat 5/7/8 data, and overlaid on a 2021 Landcover Change Monitoring System composite, constructed from Landsat 8 OLI. Blue, purple, and pink represent grasses & forbs, shrubs, and trees respectively. Red over pink likely indicates beetle and drought disturbance. Data can be used to inform management and prepare public land for ecological change in the Grand Valley region of Colorado.](/sites/default/files/styles/lis/public/2022-11/2022Sum_ID_GrandValleyEcoII_WebsiteImage_V2.jpg.webp?itok=I4kX7CdG)
Grand Valley Ecological Forecasting II (Summer 2022) Team: Bill Curtiss (Project Lead), Aliza White, Sam Majumder, Rhea Martinez Summary: Disturbances and landcover change in pinyon-juniper...
![NDWI-processed composite image from Landsat 8 OLI data of the Lower Illinois River Valley and surrounding landscapes from summer 2021. Shades of pale yellow indicate dry vegetation and dark teal represents open water, while brighter turquois values depict wet vegetation. Areas of high NDWI values are demonstrative of high presence of wet vegetation and are of interest to the Great Rivers Land Trust in identifying areas of interest for wetland conservation.](/sites/default/files/styles/lis/public/2022-12/2022Sum_JPL_LowerIllinoisEco_WebsiteImage.png.webp?itok=eCvz2h8C)
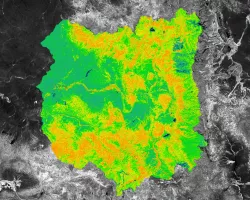
Lower Illinois River Valley Ecological Forecasting (Summer 2022) Team: Vanessa Machuca (Project Lead), Dana Myers, Hannah Rigdon, Christiana Saldana Summary: The Lower Illinois River Valley...
![Median June composite of daily evapotranspiration from ECOSTRESS before the start of the Bootleg Fire on July 6th, 2021. Evapotranspiration is shown in millimeters per day across Klamath and Lake counties in Oregon, with dark blue indicating areas with higher evapotranspiration and light tan indicating lower evapotranspiration. Evapotranspiration is an indicator of vegetation moisture and can aid wildfire modeling by locating areas undergoing water-stress and susceptible to fire.](/sites/default/files/styles/lis/public/2022-12/2022Sum_JPL_WashingtonWildfires_WebsiteImage.jpg.webp?itok=X8MZrq7U)
Oregon Wildfires (Summer 2022) Team: Brenna Hatch (Project Lead), Kenya Creer, Jennifer Sobolewski, Nicole Roberts Summary: Wildfire season in the western USA is starting earlier...
![NDMI over a wildland urban interface in central Chile generated from Landsat 8 OLI median-reduced data from March 1, 2018 through February 28, 2022. Orange areas represent vegetated shrublands and forests with low moisture content and green areas representing vegetated agricultural areas with high moisture content. The NDMI was used as a proxy for wildfire fuel moisture in a wildfire risk assessment.](/sites/default/files/styles/lis/public/2022-12/2022Sum_LaRC_ChileWildfires_WebsiteImage_V2.jpg.webp?itok=YJDde00a)
Chile Wildfires (Summer 2022) Team: Chris Matechik (Project Lead), Reuben Alter, Jennifer Ruiz, Stephen Sene Summary: In recent years, Central Chile has experienced wildfires of...
![The image displays NDVI calculated over the Guadalupe Mountain Range in Western Texas captured May 2020 by Landsat 8 OLI. Areas shaded green indicate tree canopy while yellow and red areas indicate arid landscapes. NDVI was used to visualize vegetation health and inform the National Park Service’s future management initiatives.](/sites/default/files/styles/lis/public/2022-12/2022Sum_LaRC_DelawareBasinEco_WebsiteImage.png.webp?itok=uBm4Yq0D)
Delaware Basin Ecological Forecasting (Summer 2022) Team: Jack Mezger (Project Lead), Mark Bossinger, Gillian McNamara, Quinn Heiser Summary: The Guadalupe Mountains and Carlsbad Caverns National...