Displaying 11 - 20 of 22
![NDWI-processed imagery from Landsat 8 Operational Land Imager data. This mosaicked image was taken from January to December 2021 of Jekyll Island, Georgia. NDWI contrasts the water features in a satellite image to its surroundings by measuring the moisture content. Low moisture content is shown in white, and high moisture content is shown in blue.](/sites/default/files/styles/lis/public/2023-02/2022Fall_GA_Disasters_WebsiteImage.png.webp?itok=_4Frkxe1)
Georgia Disasters (Fall 2022) Team: Isabella Chittumuri (Project Lead), Nancee Uniyal, Nathan Tesfayi, Shakirah Rogers Summary: In September 2017, Hurricane Irma made landfall in southern...
![NDBI-processed imagery from a June 2022 Landsat 9 OLI-2 image. This composite image shows the cities of Warren (top left) and Youngstown (bottom right). The areas in white and brown represent the built environment. While areas in green represent land that is not as built-up, such as forest. Built-up areas can indicate where surface run off could occur, resulting in pluvial flooding.](/sites/default/files/styles/lis/public/2023-02/2022Fall_LaRC_YoungstownWarrenDisasters_WebsiteImage.jpg.webp?itok=EkdUM8uk)
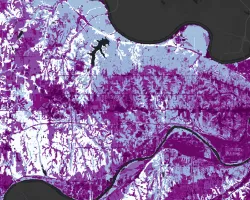
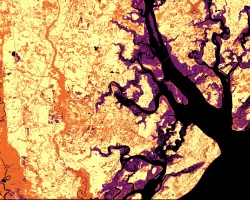
Youngstown & Warren Disasters (Fall 2022) Team: Lauren Mahoney (Project Lead), David Henriques, Nada Haddad, Thomas Ferrell Summary: Both pluvial and fluvial flooding events pose...
![Stormwater retention across Wyandotte County, Kansas. NASA GPM IMERG data for September 2020 – August 2021 and NLCD 2019 Land Cover data were used as model inputs for the InVEST Stormwater Retention Model. One model output included a stormwater retention ratio layer where darker purple values indicate poor stormwater retention and increased flood risk. Areas of poor stormwater retention can then be identified as priority regions for Green Infrastructure initiatives in Wyandotte County.](/sites/default/files/styles/lis/public/2023-02/2022Fall_MA_KansasCityDisastersII_WebsiteImage.png.webp?itok=sqRBpysQ)
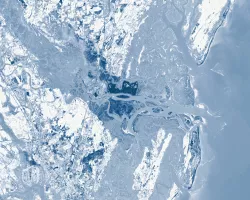
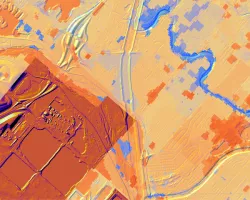
Kansas City Disasters II (Fall 2022) Team: Nora Carmody (Project Lead), Dain Kim, Kameron Lloyd, Ruby Nagelberg Summary: In pluvial flood events, stormwater runoff can...
![Landsat 8 OLI data processed into the median NDVI for 2016-2021 with an overlay showing deforestation that occurred during this time period in the Talladega National Forest. The deforestation layer is derived from Global Forest Watch's forest cover data, which uses the Landsat series, and was calculated as the difference between forested areas in 2016 and forested areas in 2021. Shades of green indicate the density of forest, while red areas indicate areas deforested in 2021.](/sites/default/files/styles/lis/public/2023-02/2022Fall_PUP_SoutheastUSClimate_WebsiteImage.jpeg.webp?itok=9thA-LxI)
Topic
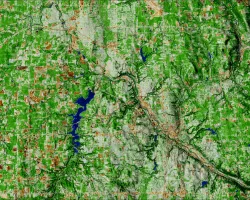
Southeast US Climate (Fall 2022) Team: Heidi Rogers (Project Lead), Mistaya Smith, Maggie Mason, Anish Holla Summary: Deforestation, a significant contributor to carbon emissions, is...
![Daytime land surface temperature for Wichita, Kansas summer 2017-2022, retrieved through Landsat 8 TIRS and Landsat 9 TIRS-2 surface temperature. Located in the northwest corner of the city, this image depicts higher temperatures through dark orange hues in developed areas, and lighter orange hues to blue colors where the temperature is lower. The land surface temperature was utilized to construct a heat vulnerability index for the city, looking into disproportionate impacts on underserved communities.](/sites/default/files/styles/lis/public/2023-02/2022Fall_VEJ_WichitaClimateII_WebsiteImage.png.webp?itok=oO4F6bs4)
Topic
Wichita Climate II (Fall 2022) Team: Ritisha Ghosh (Project Lead), Richard Kirschner, Ria Mukherjee, Raina Monaghan Summary: Wichita, Kansas is experiencing a host of climate...
![The image was collected by Landsat 9 on January 26 of 2023 showing Skidaway Island and waterways on the Georgia coast. The data shows areas of healthy vegetation and urban areas using a Normalized Difference Vegetation Index (NDVI). The darker orange represents grass and urban areas. Yellow and purple represents forested and densely vegetated areas. The black represents open water.](/sites/default/files/styles/lis/public/2023-05/2023Spring_GA_GeorgiaDisastersII_WebsiteImage.jpg.webp?itok=zhMhpiSz)
Georgia Disasters II (2023 Spring) Team: Shakirah Rogers (Project Lead), Nathan Tesfayi, Matthew Murray, Clarence Jackson Summary: Heirs property owners are especially vulnerable to natural...
![Soil organic carbon (SOC) is measured here for a depth of 0-5cm from Soil Moisture Active Passive from January 1, 2021 over Peru and Bolivia. SOC is visualized against combined MODIS landcover data for the year 2000 from Aqua and Terra. Shades of lighter pink indicate lower SOC content and darker shades of pink and purple indicate higher SOC content. Conservation International is interested in mapping areas of high SOC content for their conservation efforts.](/sites/default/files/styles/lis/public/2023-05/2023Spring_GSFC_Peru%26BoliviaClimate_WebsiteImage.jpg.webp?itok=RJ-8Cuuo)
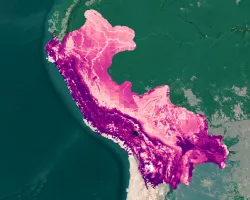
Peru & Bolivia Climate (2023 Spring) Team: Aarti Arora (Project Lead), Aaron Carr, Arina Fuqua, Haydee Portillo Summary: Irrecoverable carbon (IC) reserves contain large stores...
![The green areas show stable forest in NW Alabama classified by both National Land Cover Dataset (2016-2019) and Landscape Change Monitoring System(2016-2021), and the pink areas are areas where forest cover loss was sensed by NLCD, LCMS, LandTrendr (2016-2021), and Global Forest Watch (2016-2021). These datasets and the basemap were made with Landsat 5 Thematic Mapper, Landsat 7 Enhanced Thematic Mapper Plus, and Landsat 8 Operational Land Imager.](/sites/default/files/styles/lis/public/2023-05/2023Spring_MSFC_SoutheastUSClimateII_WebsiteImage.jpg.webp?itok=3mAADCnc)
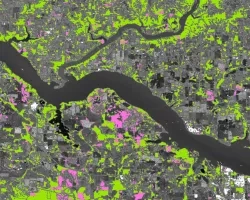
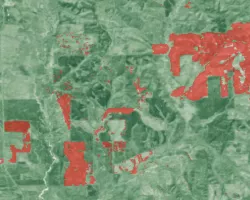
Southeast US Climate II (2023 Spring) Team: Cassie Ferrante (Project Lead), Katherine Scott, James Karroum, Cate Lull Summary: The balancing of atmospheric CO2 sources and...
![Normalized Difference Snow Index (NDSI) Image calculated from a May 2021 Landsat 8 top-of-atmosphere (TOA) reflectance image. The purple area depicts areas without snow and the yellow area represents areas with snow cover. This information can be used by refuge managers to monitor snow conditions and prepare for the ecological, cultural, and landscape impacts caused by snow.](/sites/default/files/styles/lis/public/2023-05/2023Spring_NCEI_NortheastAlaskaClimate_Websiteimage.jpg.webp?itok=vgp5Y_zU)
Northeast Alaska Climate (2023 Spring) Team: Kristin Anderson (Project Lead), Omeed Arooji, Isabella Chittumuri, Tom Germann Summary: Alaska is experiencing climate change at an unprecedented...
DEVELOP
Wildland Fires
Climate
Capacity Building
Ecological Conservation
Health & Air Quality
Water Resources