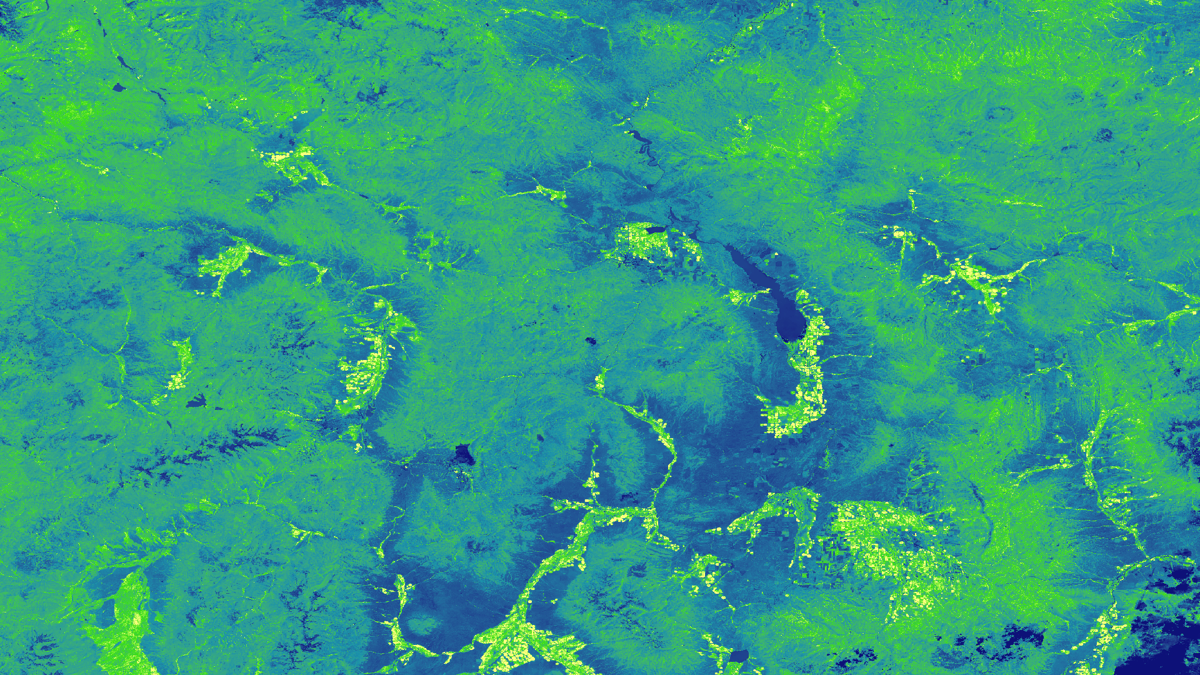
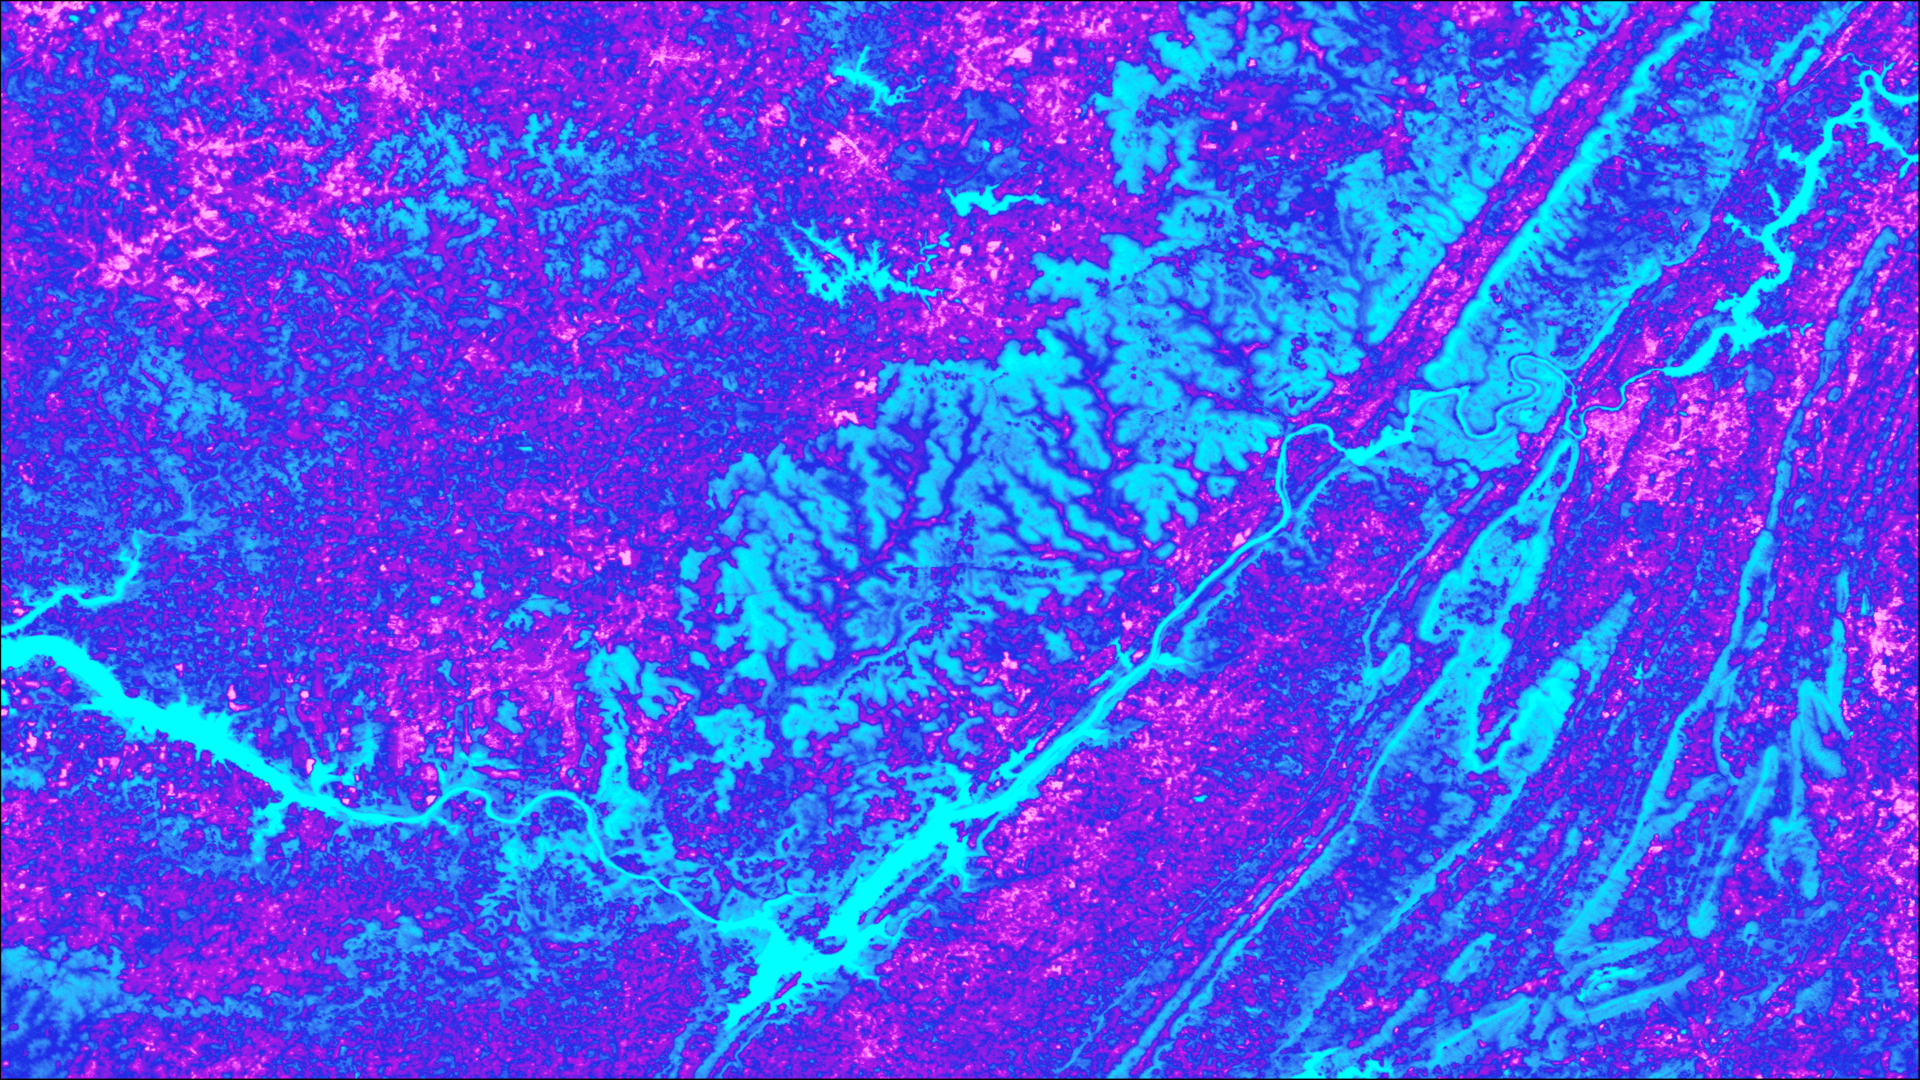
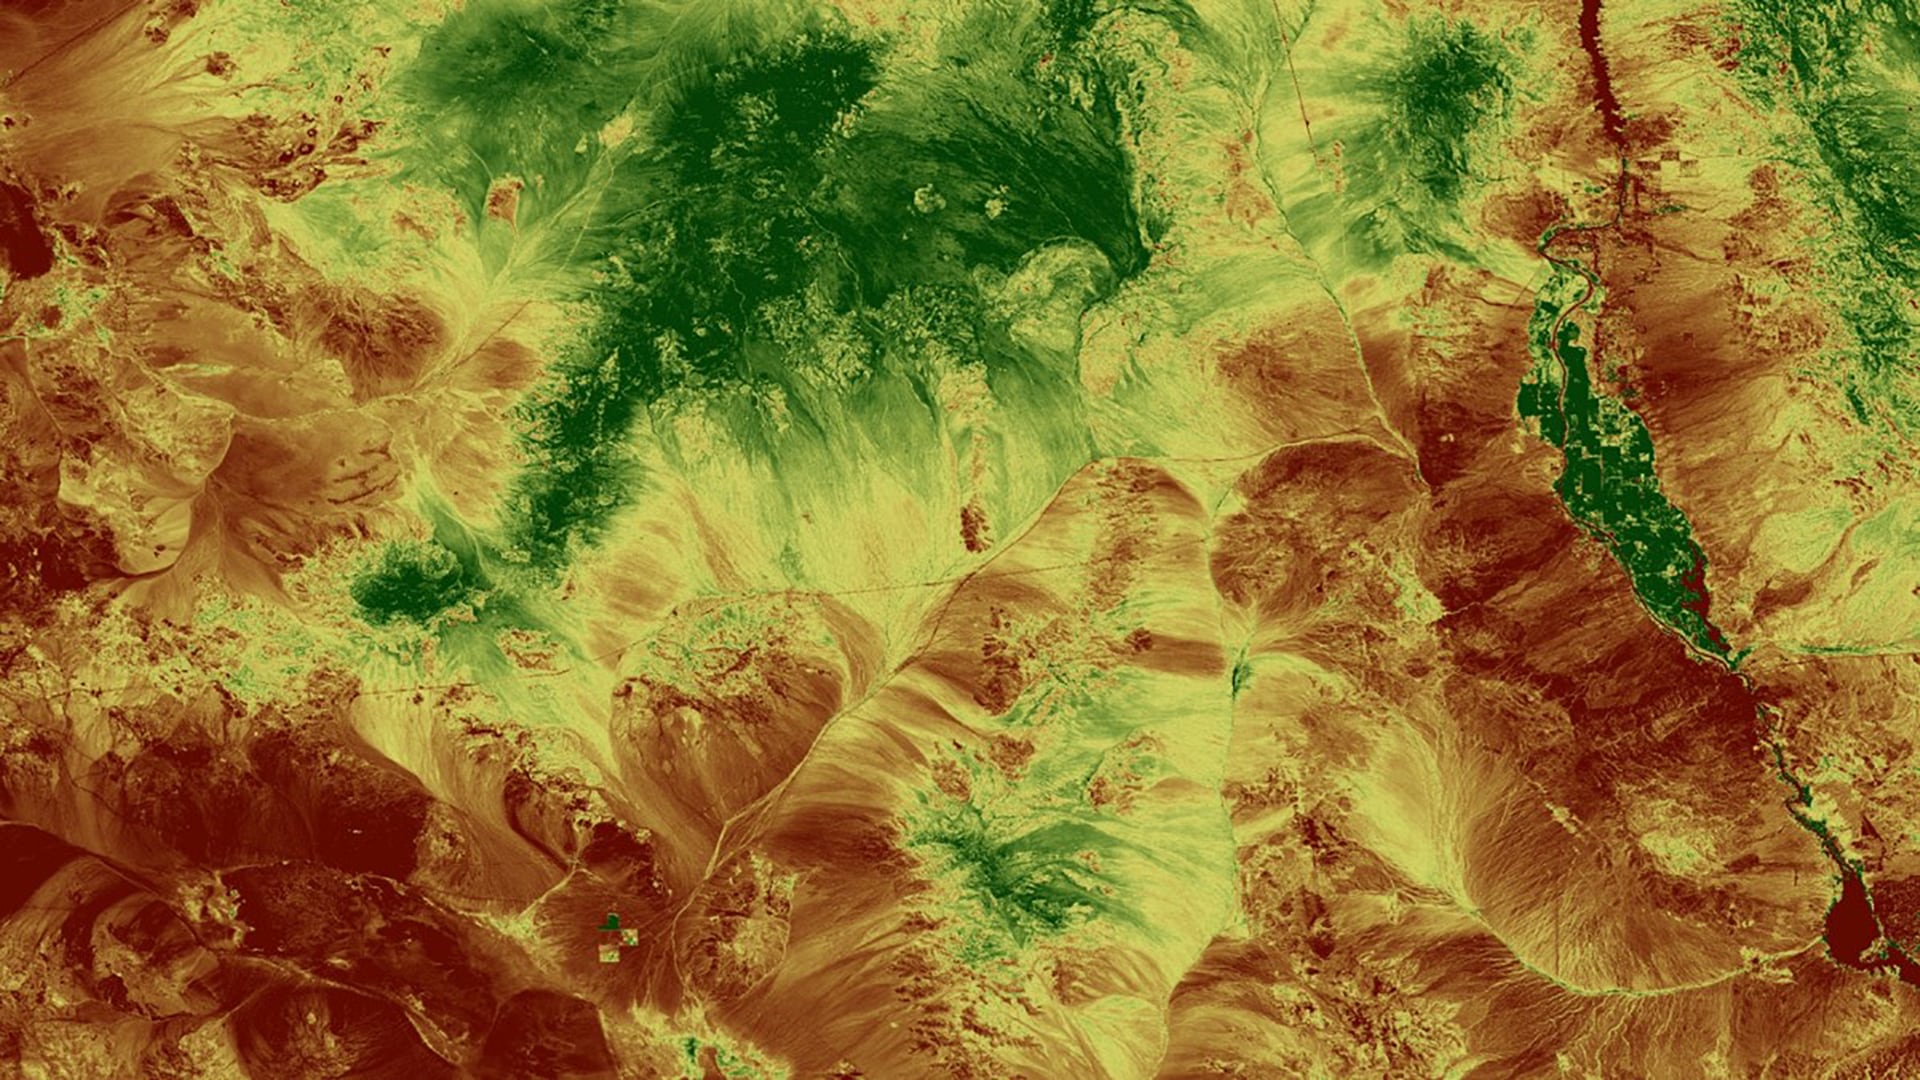
Principal Investigator

McKenna Brahler

Imagen
Likelihood of transition from wetland to other land cover by 2050, based on wetland loss patterns from 2010 Landsat 5 TM and 2020 Landsat 8 OLI imagery. Areas with highest likelihood of loss on the Eastern shore of Delaware are shown in red, with those likely to persist in light blue. A LiDAR Digital Elevation Model (2013-2014) indicates low elevation in dark blue. Predicting wetland trends allows local stakeholders to prioritize management of wetland areas.  Keywords: Delaware, Landsat, wetlands, marsh

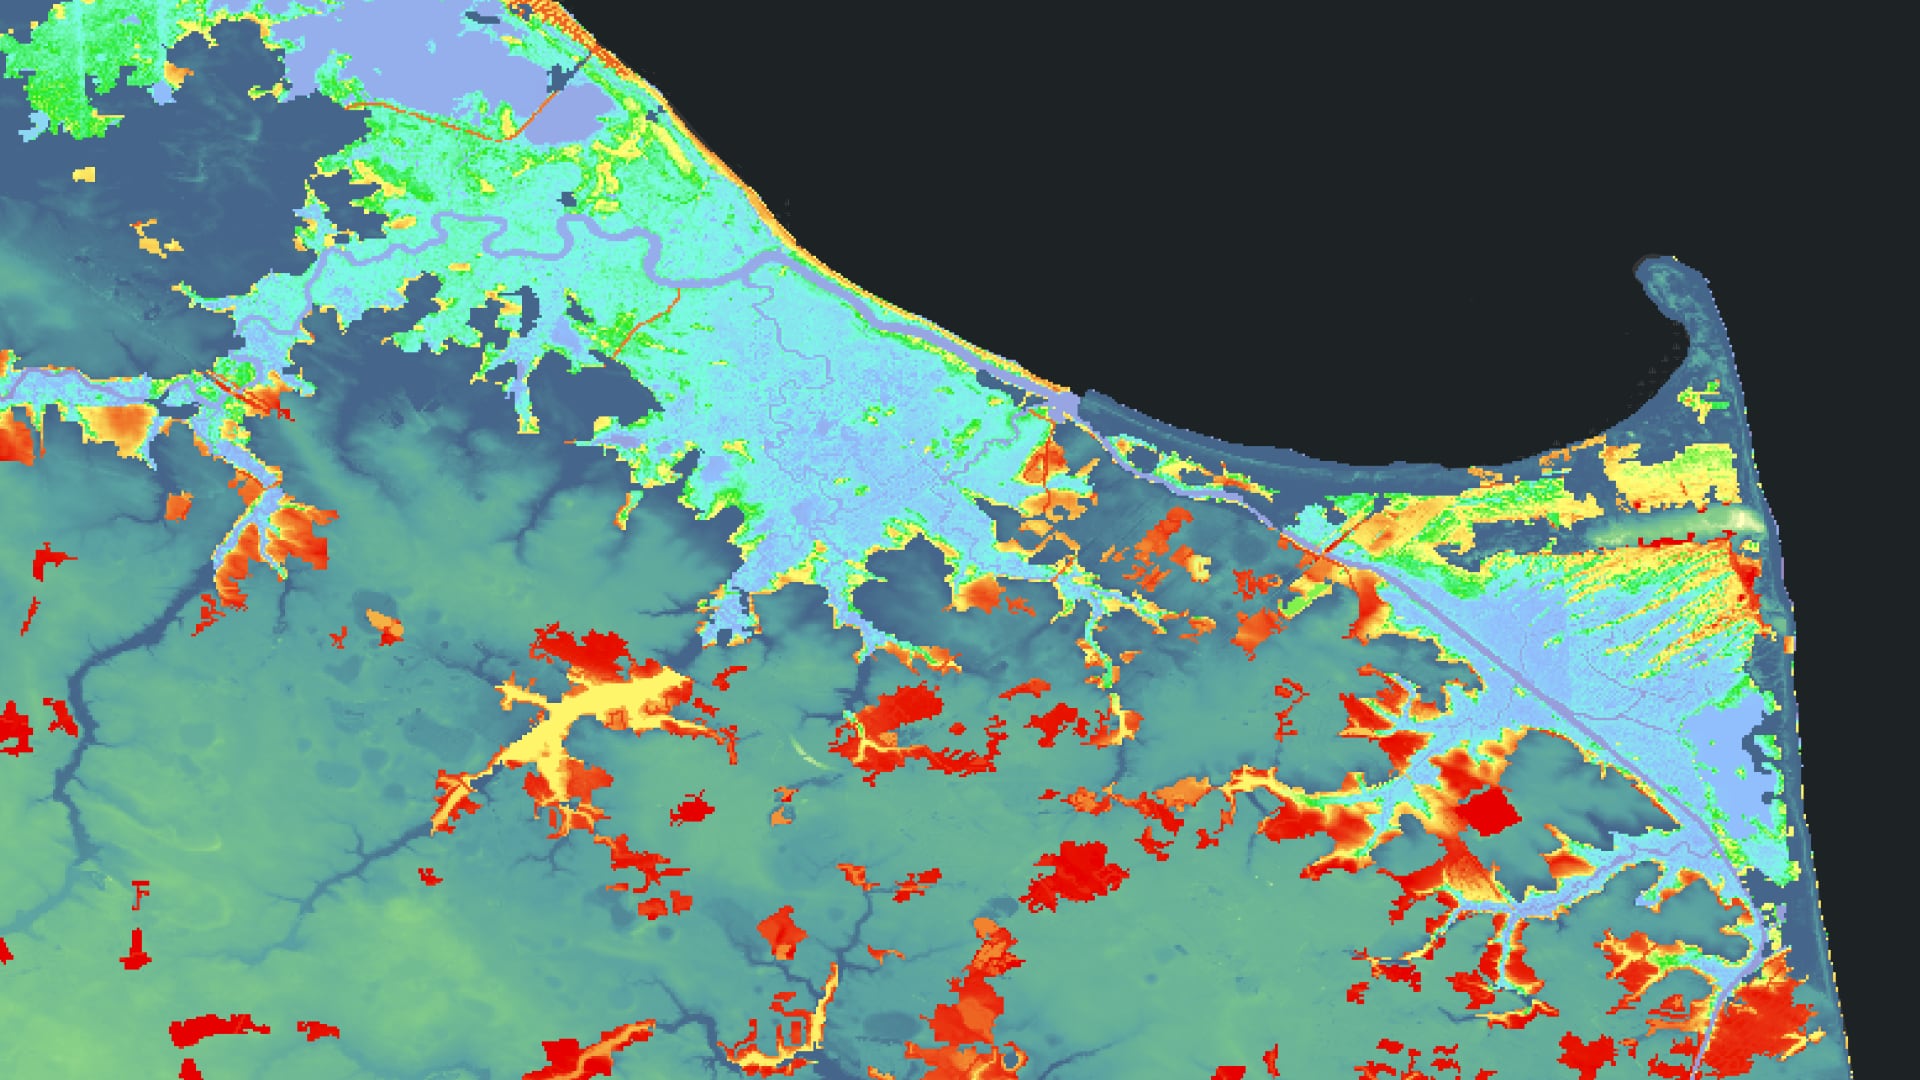
Tidal wetlands provide vital resources for the state of Delaware, crucial not only for maintaining important ecosystem functions, but also for providing human populations with substantial services. Healthy wetland networks offer protection from severe weather, reduce flooding, improve water quality...

Principal Investigator

Brandy Nisbet-Wilcox

Imagen
Summer land surface temperatures across the Philadelphia region from Landsat 8 OLI/TIRS surface reflectance imagery (2017 - 2019).  Philadelphia has elevated temperatures (orange) compared to surrounding rural areas (dark purple).  Keywords: Philadelphia, Landsat 8 OLI/TIRS, land surface temperature, urban heat island, Brandy Nisbet-Wilcox, Samuel Meltzer, Spencer Nelson, Charlotte Wagner

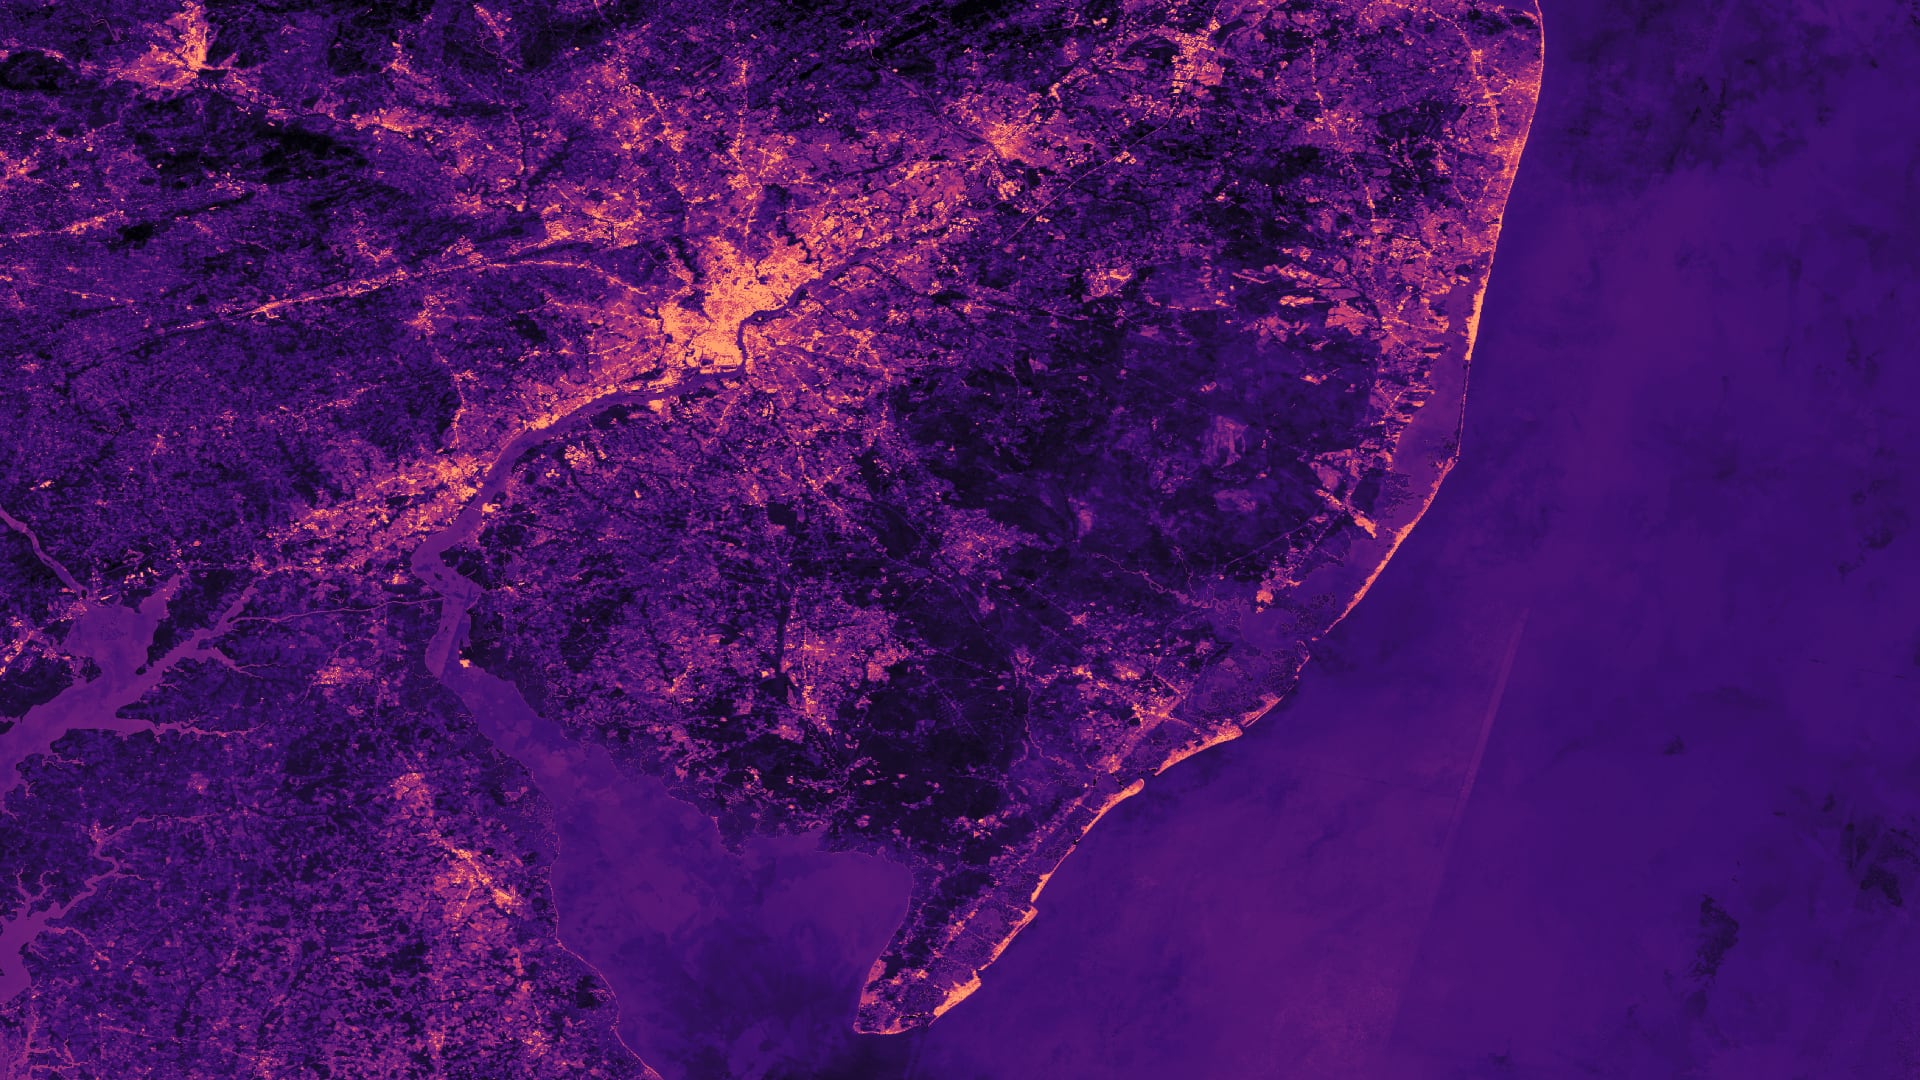
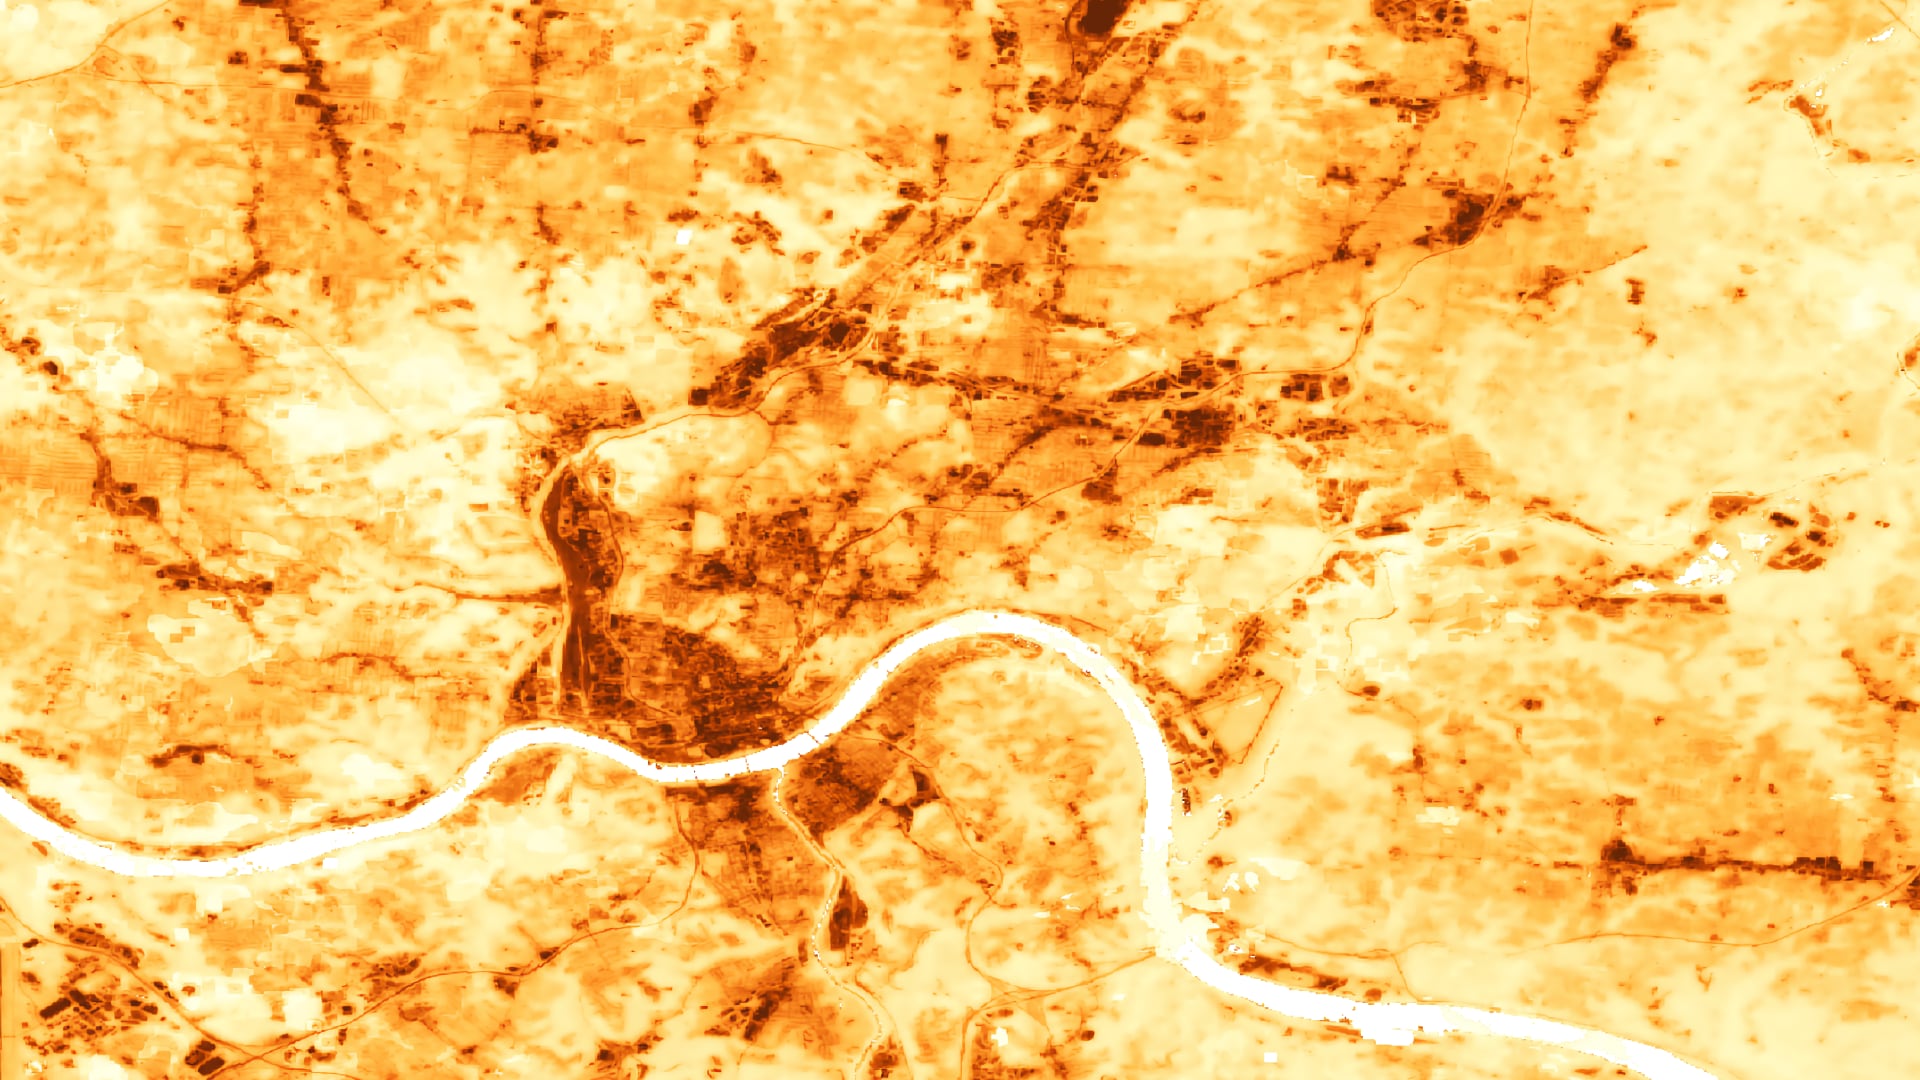
Heat is the leading cause of weather-related deaths in the US, with heat-related hospitalizations increasing by 2-5% between 2001-2010. In Philadelphia alone, 137 heat-related deaths were recorded between 2010-2018, while a total of 18 daily temperature records have been set...

Principal Investigator

Caley Feemster

Imagen
An output raster using the Q-test algorithm showing land change in the Madre De Dios region in Peru is processed with NASA's Shuttle Radar Topography Mission (SRTM) using elevation data from January 2019 derived from Advanced Spaceborne Thermal Emission and Reflection Radiometer (ASTER), Global Digital Elevation Model 2 (GDEM2), USGS Global Multi-resolution Terrain Elevation Data (GMTED), and USGS National Elevation Dataset (NED). Darker areas of red show higher levels of elevation and lighter reds show lower elevation.   Keywords: SRTM, Q-Test, elevation, Peru

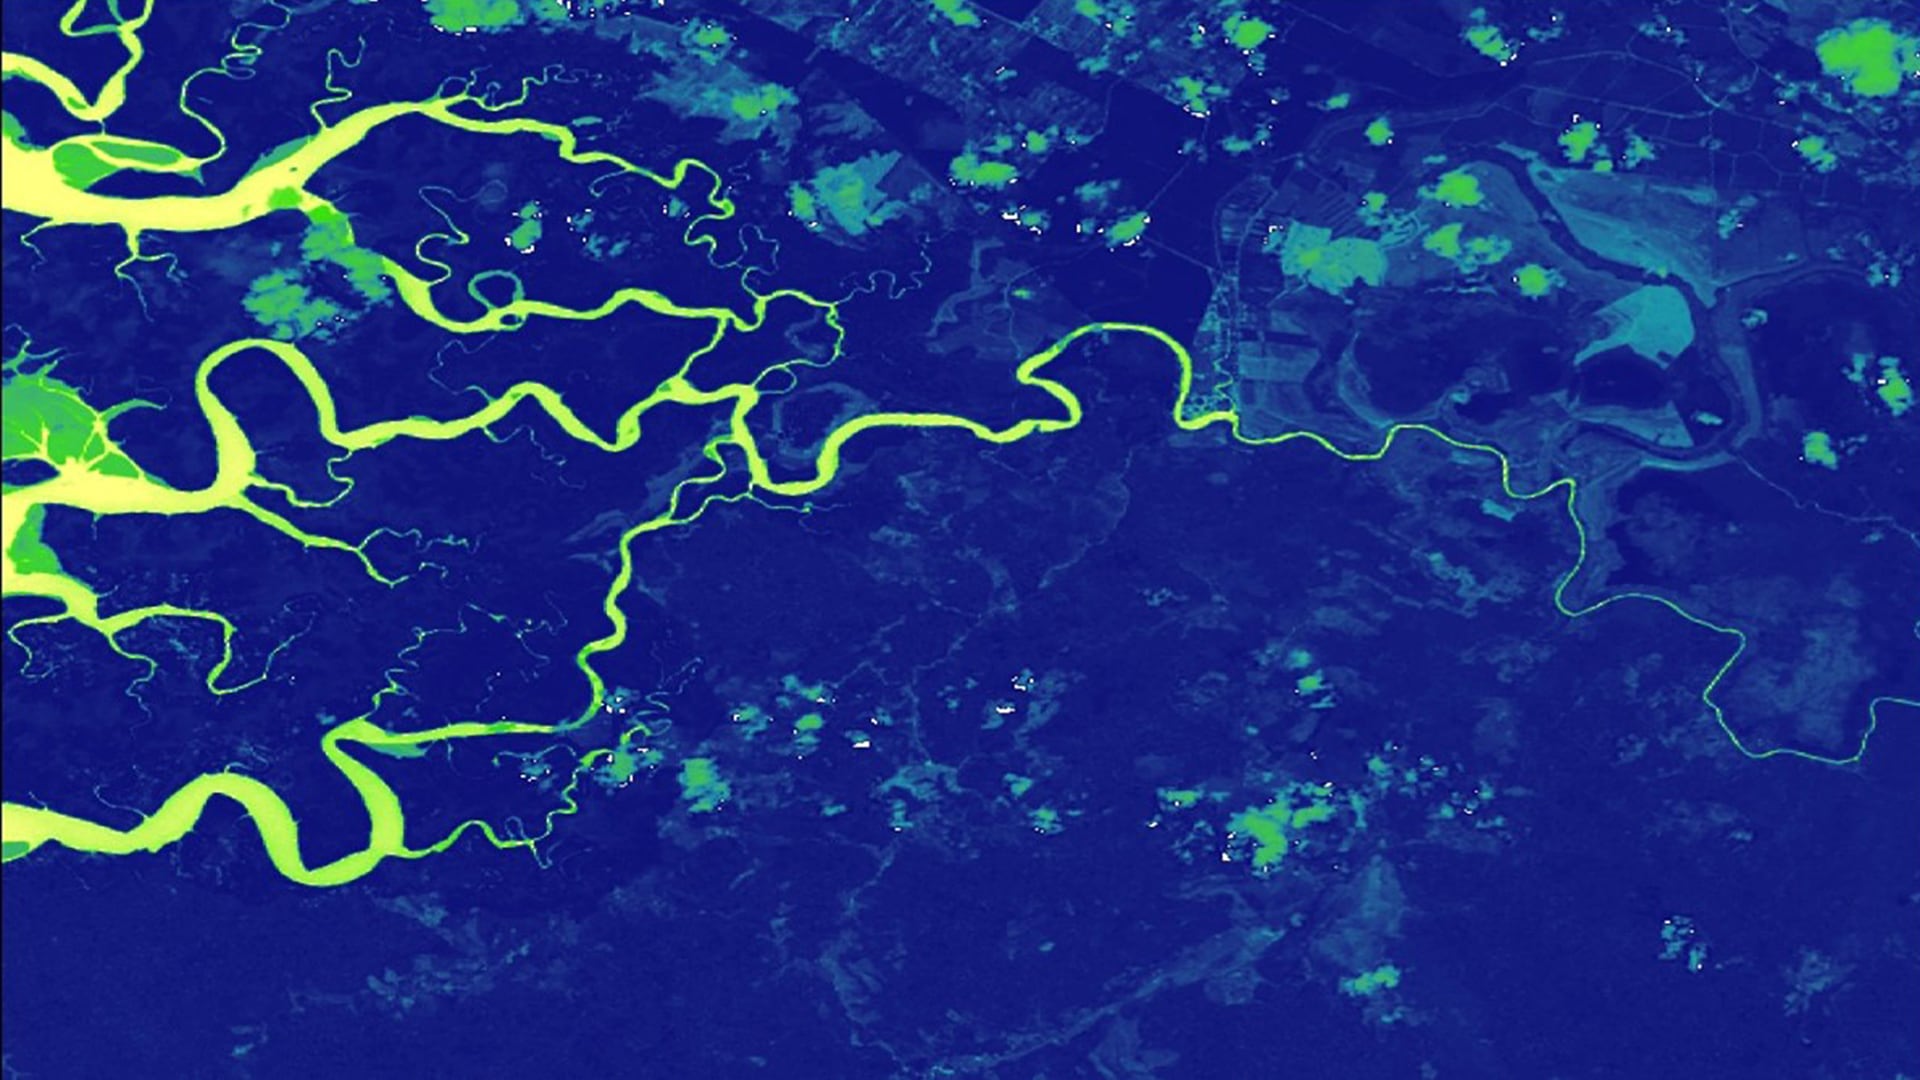
Artisanal and small-scale gold mining (ASGM) is responsible for a large fraction of deforestation and disturbance in Amazonia. These activities cause severe impacts on the rainforest ecosystem and socioeconomic state of the region. NASA DEVELOP partnered with the Asociación para...

Principal Investigator

Pamela Kanu

Imagen
Assessing the Feasibility of Using NASA Earth Observations to Monitor Trends in Runoff and Storm Water Discharge of the Biscayne Bay

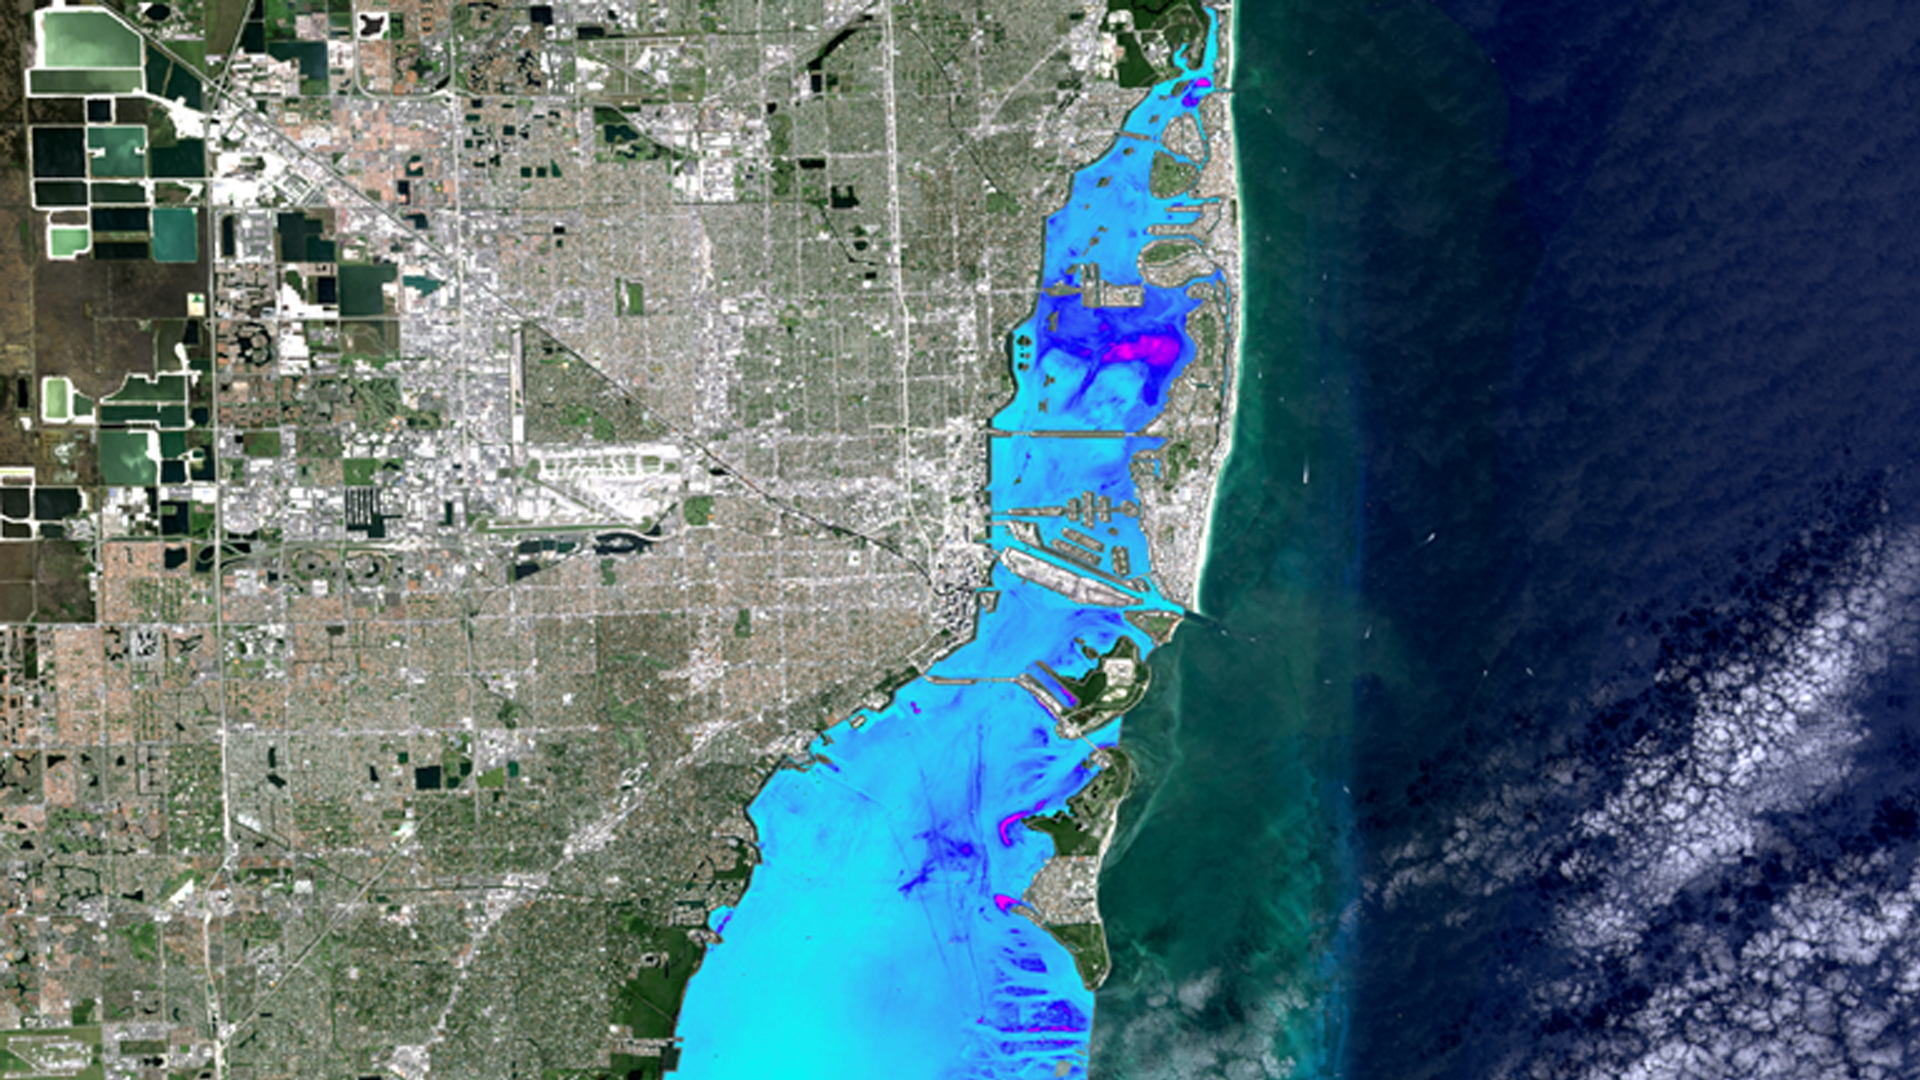
Submerged Aquatic Vegetation (SAV) is an important component of coastal ecosystems, and is vulnerable to increased turbidity in the water column. It provides stability and protection to sediment deposits, and offers food and shelter to economically valuable species of marine life. Recent urban development and...

Principal Investigator

Lisa Dong

Imagen
Imagery showing temperature change between day and night using 2019 ECOSTRESS surface temperature data from September 1st at 3:09 am and August 30th at 11:18 am (CT). The Tennessee River, which is used to cool the Browns Ferry and Sequoyah nuclear plants, is displayed. Light shades of blue represent negative or low increase in temperature and light shades of purple represent high temperature increases. Calculating temperature change allows stakeholders to analyze temperature variation over time.  Keywords: Temperature, Tennessee Valley Energy, Nuclear Power Plants

Aquatic ecosystems are susceptible to biodiversity loss due to increased water temperatures, which can select for heat-tolerant species and lead to a loss of locally adapted species that have a narrow temperature range. Regulations concerning heated effluent from nuclear power...

Principal Investigator

Suravi Shrestha

Imagen
Assessing Threats to River Water Quality and Mangrove Health Based on Watershed Land Use on the Osa Peninsula, Costa Rica

The Osa Peninsula, located in the southern region of Costa Rica's Pacific Coast, is one of the most biologically-diverse places on Earth and is a popular ecotourism destination. However, the area faces watershed degradation and loss of biodiversity due to deforestation, pollution from agriculture, and...

Principal Investigator

Jonathan O'Brien

Imagen
Assessing Urban Heat as it Relates to Social Vulnerability and Land Use Changes in Las Cruces, New Mexico

Extreme heat during the summer months is a major public health issue in many cities worldwide. Local governments are increasing efforts to mitigate heat in cities through the implementation of infrastructure adaptations, including expansion of the urban tree canopy and white roofing, as well as...

Principal Investigator

Paxton LaJoie

Imagen
Median summer daytime land surface temperature (LST) imagery displaying Cincinnati, Ohio and Northern Kenton County, Kentucky using Landsat 8 OLI data from June – August of 2019 – 2020. LST was derived from the median NDVI, brightness temperature, emissivity, and thermal band. Lighter shades of yellow indicate lower median LST, whereas darker shades of brown indicate higher median LST. Areas of higher LST should be prioritized for heat mitigation efforts.  Keywords: urban heat island, land surface temperature

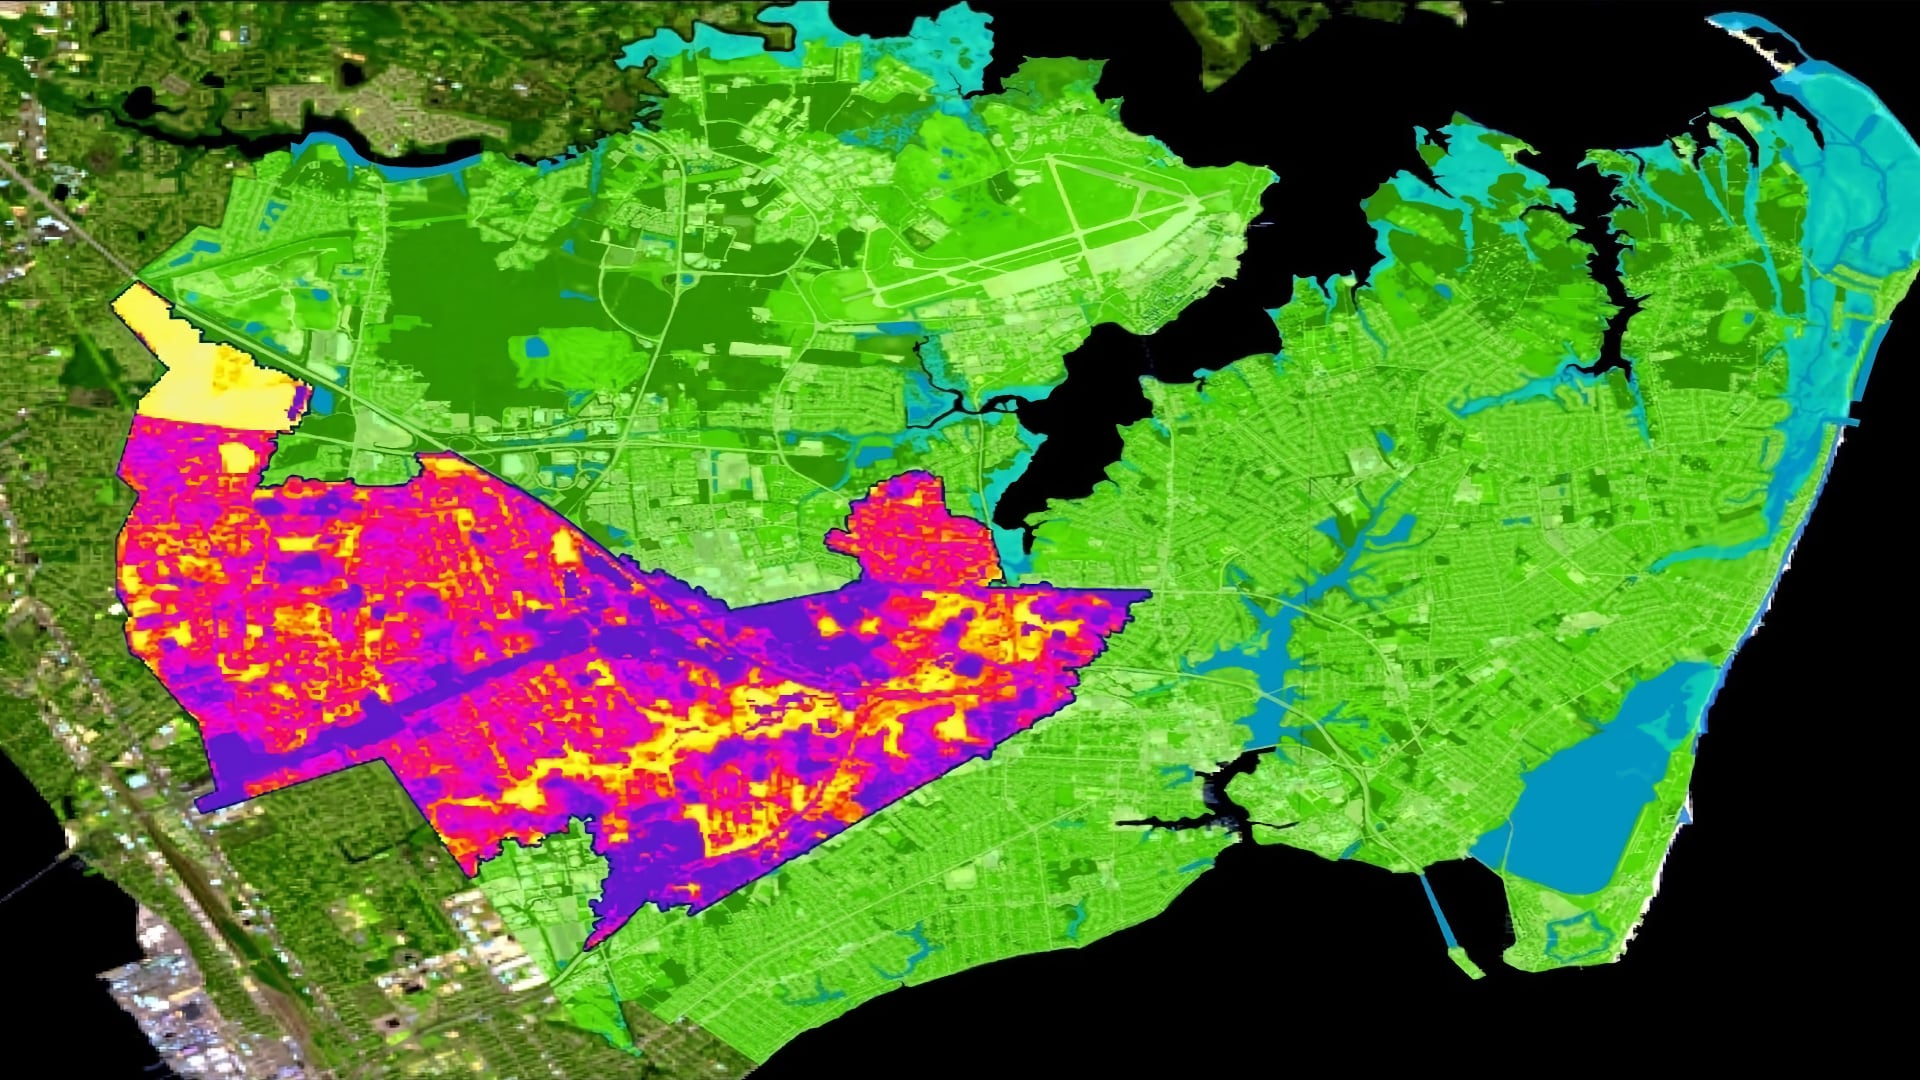
The Urban Heat Island (UHI) effect is a phenomenon characterized by urban areas experiencing temperatures that are, on average, warmer than surrounding suburban and rural regions. UHIs are fueled by expansive impervious surfaces, vehicle emissions, and insufficient urban green space...

Principal Investigator

Stephanie Kealy

Imagen
This image includes a false color composite of Landsat 5 TM imagery (August 8 to 16, 2011), high-resolution classified imagery from the City of Hampton (January 2018), and percent tree canopy cover from regression analysis for the Hampton Roads peninsula in Virginia. The yellow represents high tree canopy cover (80 to 100%) and the dark purple represents low cover (0 to 10%). Percent tree canopy cover allows for the City to visualize areas for improvement.

Hampton Roads’ 1.6 million residents thrive on bustling military, harbor, and environmental industries. The region’s stakeholders identified an increasing flood and water quality risk due to urbanization, a changing climate, and sea-level rise. These hazards threaten not only the livelihood...

Principal Investigator

Jacob Ramthun

Imagen
Assessing Vegetation and Precipitation Indices to Aid Bighorn Sheep Habitat Monitoring and Management

Desert bighorn sheep (Ovis canadensis; BHS) habitat selection is influenced by the relationship between precipitation patterns and habitat vegetation availability. The ability to effectively measure habitat resource quality and availability, and understand mortality rates caused by disease and predation is needed to enhance BHS habitat...