Principal Investigator

Trista Brophy

Imagen
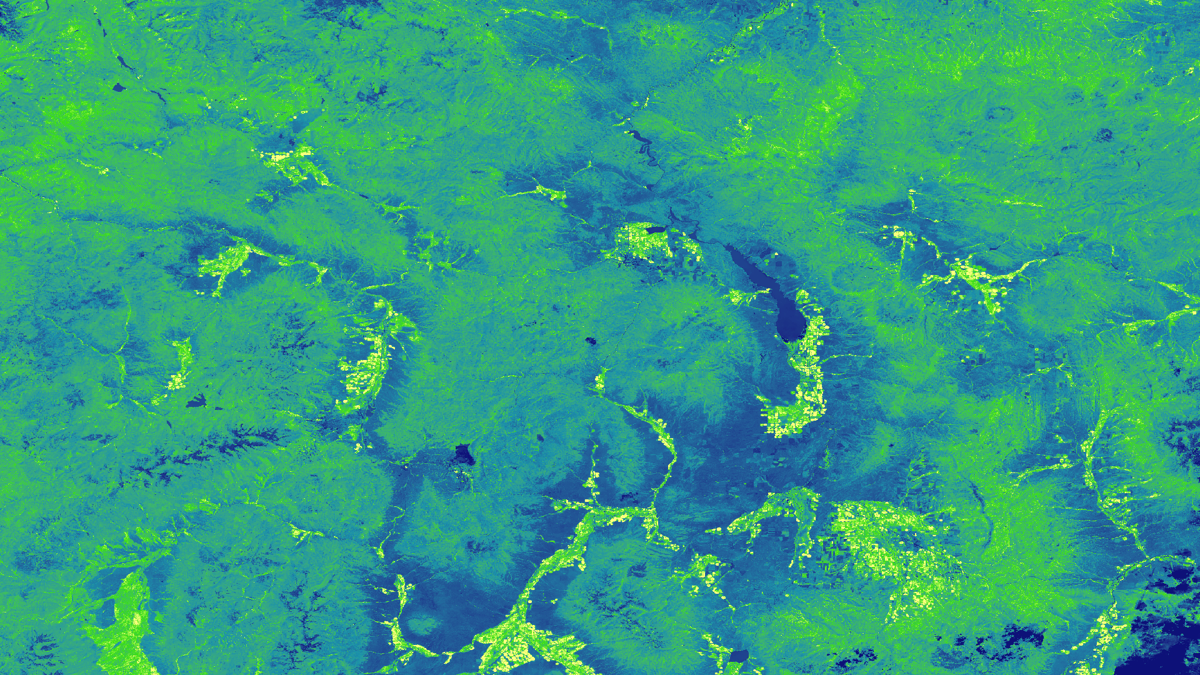
Curve number runoff calculated from NDVI-processed imagery using 2019 Landsat 8 OLI data. The southern portion of the county, with the City of Manhattan to the east, is displayed. Blue shades indicate lower runoff and red shades indicate higher runoff. Local stakeholders could expect more flooding to occur where there is higher runoff and should focus on these areas during resiliency planning.   Keywords: curve number runoff, NDVI, land use change, Trista Brophy, Ella Griffith, Elizabeth Nguyen, Adelaide Schmidt​

Riley County, Kansas, has observed increased levels of flooding, potentially due to changes in land use/land cover (LULC) and seasonal vegetation variation. This study contrasts two methods of generating runoff curve numbers (CN) from 2006-2020. (1) The traditional Soil Conservation...

Principal Investigator

Rya Inman

Imagen
False color composite (bands 5, 4, and 3) of recent (2016 to 2019) leaf-off vegetation in the New York Adirondacks region processed using Landsat 8 OLI data overlaid with the HydroSHEDS Hydrologically Conditioned DEM from the World Wildlife Fund (2000) in cyan. Pure eastern hemlock stands are indicated in red and hemlock-dominant stands are indicated in orange. Areas of pure eastern hemlock should be the primary focus of land managers’ conservation efforts against the invasive hemlock woolly adelgid.

Hemlock woolly adelgid (HWA; Adelges tsugae) is an invasive species that threatens eastern hemlock (Tsuga canadensis) in US forests. Eastern hemlock has a greater capacity to store carbon, regulate stream temperatures, and provide habitat for wildlife compared to sympatric tree species. The New...

Principal Investigator

Ryan Lam

Imagen
Forecasted NDVI-processed imagery using 2021 MODIS data with a soybean fields (purple) overlay in central Argentina. Magenta zones indicate low values of NDVI, such as water or bare soil. Blue and cyan represent moderate to high values of NDVI, denoting areas of higher biomass. Understanding the health and status of the agricultural crop growth allows the Buenos Aires Grain Exchange highlight potential food insecurities in the region to farmers, consumers, and policymakers.  Keywords: NDVI, crop yield forecasting, Brooke Egley, Ryan Lam, Tyler Pantle, Sienna Templeman, Caroline Williams

Early harvest information helps drive the national budget in Argentina, providing valuable planning information to identify potential food-insecure regions, anticipate transportation and storage demands, predict price fluctuations, and project commodity trends. However, crop yield estimates are currently subjective, based on...

Principal Investigator

Molly Spater

 
Imagen
Demonstrating the Potential Applications of ECOSTRESS Evapotranspiration Products in Plant Phenotyping and Predicting Patterns in Global Species Richness

A changing climate has the potential to affect both agricultural productivity and global levels of biodiversity. In the agricultural context, the ability to rapidly identify more water-efficient and drought tolerant crop varieties will be vital for international food security. Current methods of phenotyping superior...

Principal Investigator

Margaret Mulhern

Imagen
Designing a Modeling User Interface Incorporating Landsat to Monitor Changes in Riparian Vegetation and Endangered Fish Habitat

Since the completion of the Flaming Gorge Dam in 1964, artificial flow releases along the Green River have promoted channel narrowing and encouraged non-native vegetation encroachment into the active stream channel. These changes in the Green River's flow regime have reduced the backwater habitat of...

Principal Investigator

Zackary Werner

Imagen
Presence of fog and low cloud cover in July 2020 derived from Terra MODIS data, overlaid on a true color Landsat 8 OLI image of San Francisco Bay, California taken August 2020. Bright red shades represent higher fog frequency, up to 29 days per month, while blue and transparent indicate fewer than 8 days. The presence of fog is vital for coast redwood trees and projecting future fog presence can support redwood habitat conservation efforts.   Keywords: MODIS, fog, cloud, climate change, coast redwood (Sequoia sempervirens), San Francisco Bay, California

Fog and low clouds play an important role in providing moisture to coastal ecosystems. Coast redwood (Sequoia sempervirens) forests are currently distributed along a narrow strip of coastline in California and Oregon and rely on the presence of...

Principal Investigator

Veronica Warda

Imagen
Detecting Changes in Nighttime Sky Brightness over Grand Teton National Park with the Suomi NPP VIIRS Sensor

As more outdoor lighting is installed for safety and development, light pollution has become a growing problem that threatens the quality of life for humans and wildlife. The onset of light pollution in cities and dark sky areas not only hinders humans from seeing the...

Principal Investigator

Molly Azami

Imagen
Greenest pixel composite of Normalized Difference Vegetation Index (NDVI)-processed image using 2019 data from Landsat 8 Operational Land Imager  blended with a true color band combination (3, 2, 1) of the Western coast of Costa Rica in the Osa region. The areas of highest vegetation are represented in green, areas of lowest vegetation are represented in red, and water is represented in blue. The land cover characteristics shown in an NDVI image improve land cover classification accuracy.  Keywords: NDVI, Landsat, land cover

La Amistad International Park connects southern Costa Rica and northern Panama as part of the Mesoamerican Biological Corridor. Despite the existence of conservation programs within this region, human-induced and natural ecological disturbances threaten native species and alter forest ecosystems. To...

Principal Investigator

Hikari Murayama

Imagen
From left to right: 2018 through 2019 Normalized Difference Vegetation Index (NDVI), 2018 through 2019 Enhanced Vegetation Index (EVI), 1987 through 2019 EVI change, and 2018 land use/land cover classification derived from Landsat 5 TM and Landsat 8 OLI data. Dark green, purple, magenta, and green indicate areas of high or increased vegetation. These parameters helped assess habitat connectivity for a jaguar corridor in the southern part of Puntarenas province in Costa Rica.

Costa Rica contains many diverse environments, including La Amistad International Peace Park in the Talamanca Mountains and Corcovado National Park on the Osa Peninsula. Jaguars (Panthera onca) can be found throughout these two parks, but urbanization and agricultural development have...

Principal Investigator

Chloe Schneider

Imagen
August 2019 Composite Moisture Index calculated from SMAP, MODIS NDSI, SNODAS SWE, and SNODAS snow depth data overlayed on mean MODIS NDSI data for December 2019 to February 2020 for the Missouri River Basin at a HUC 2 Region 6 scale. Purple CMI values correspond to wetter areas whereas yellow areas correspond to drier areas. Lighter shades of blue for the NDSI data represent more snow cover for that area.   Keywords: CMI, MODIS NDSI, SNODAS SWE, SNODAS snow depth, SMAP, Missouri River Basin

The Missouri River Basin provides irrigation water for a substantial part of the domestic agricultural sector within the United States. Drought events pose a significant threat to the economic livelihoods of dependent individuals, industries, and ecosystems (e.g. farmers, local tribes...