Displaying 201 - 210 of 274
![Website Header](/sites/default/files/styles/lis/public/2021-10/Website_Header_v2.jpg.webp?itok=mrn7M17i)
Training Type
Level
Advanced
Date
Noviembre 30, 2021 - Diciembre 07, 2021
![Ag 2022 Website Header](/sites/default/files/styles/lis/public/2022-03/Ag2022%20-%20Website%20_Header.png.webp?itok=qOt3YRE6)
Training Type
Level
Advanced
Date
Abril 12, 2022 - Mayo 03, 2022
![NDVI image displaying diverse land uses around Puerto Maldonado, Peru. Derived from Landsat 8 OLI, the image is a cloud-removed, composite mean from all available images over the 2020-2021 Peruvian wet season (October – April). Light pinks indicate low photosynthetic activity, and dark pinks and purples indicate high photosynthetic activity. These NDVI data inform land use analyses, which can assist public health and environmental officials in understanding the relationship between land cover and zoonotic d](/sites/default/files/styles/lis/public/2022-03/2021Fall_GA_PeruHealthAQII_WebsiteImage.png.webp?itok=K5sKlDb6)
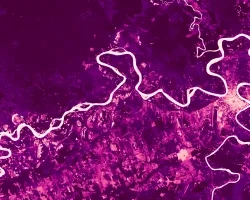
Peru Health & Air Quality II (Fall 2021) Team: Jennifer Rogers (Project Lead), Melanie Cabrera, Gayatri Girirajan, and Julianne Liu Summary: Peru's Madre de Dios...
![An NDWI waterbody mask derived from Landsat-8 OLI cloud-masked imagery from March-May 2019-2021 is shown in blue at 10-meter resolution over Mexico, Belize, and Guatemala. The ALOS-PALSAR-2 fine-beam L-band false color composite includes Refined Lee speckle filtered HV, HH, HH/HV bands. Darker and brighter green hues represent to low and high backscatter, respectively. Differentiating between open water, like the Hondo River, from vegetated inundation is important when distinguishing inundation by land cove](/sites/default/files/styles/lis/public/2022-03/2021Fall_JPL_MayaForestWaterResourcesII_WebsiteImage.png.webp?itok=WSwTB7q7)
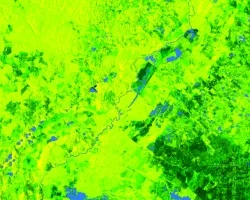
Maya Forest Water Resources II (Fall 2021) Team: Stephanie Jiménez (Project Lead), Karen Alvarez, Rene Castillo, Daniel Nohren, and Stephanie Lawlor Summary: To monitor seasonal...
![Processed imagery using 2020 Landsat 8 OLI data showing turbidity. Fire Island, a barrier island located in New York, is displayed on January 21, 2020. Shades of red indicates more turbidity and shades of blue indicate less turbidity, while black indicates land. Lower turbidity indicates areas with less sediment movement.](/sites/default/files/styles/lis/public/2022-04/2021Fall_MA_FireIslandWater_WebsiteImage_1.png.webp?itok=6Qx7-qJW)
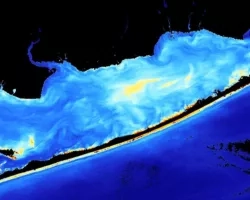
Fire Island Water Resources (Fall 2021) Team: Kelly Young (Project Lead), Tyler Albrethsen, Yuhe Chang, Brenna Hatch, and Lisa Tanh Summary: Fire Island National Seashore...
![Terra MODIS-processed imagery using version 6 MOD16A2, calculated by averaging monthly evapotranspiration data from 2001 to 2020. This image includes several central Midwestern states along the Great Lakes. The lighter green areas indicate high levels of evapotranspiration affecting the water budget and health of agriculture while the purple areas represent no data values consistent of urban landscapes with impervious surfaces or large bodies of water.](/sites/default/files/styles/lis/public/2022-03/2021Fall_NC_MidwestWaterResources_RawWebsiteImage_RD.jpg.webp?itok=Q6pTpnRi)
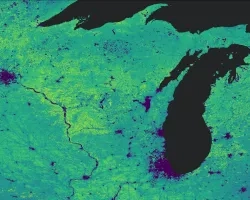
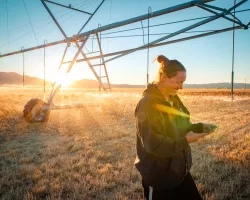
Midwest Water Resource (Fall 2021) Team: Emma Myrick (Project Lead), Erica Barth-Naftilan, Erin Shives, and Alec Solberg Summary: Evapotranspiration (ET) is a climatic variable critical...
![Ag 2022 Website Header](/sites/default/files/styles/lis/public/2022-03/Ag2022%20-%20Website%20_Header.png.webp?itok=qOt3YRE6)
Training Type
Level
Advanced
Date
Abril 12, 2022 - Mayo 03, 2022