Displaying 551 - 560 of 568
![Average aerosol optical depth (AOD) for the months of May and June in 2015 in Oregon and Washington, derived from MODIS data. Orange represents higher aerosol concentrations whereas purple represents areas with lower aerosol concentrations. The AOD averages show higher observed AOD along the coasts of Oregon and Washington.](/sites/default/files/styles/lis/public/2024-01/2023Sum_NC_PacificNorthWestHAQ_WebsiteImage.jpg.webp?itok=CKJ1vDx_)
Topic
Pacific Northwest Health & Air Quality (Summer 2023) Team: Abby Sgan (Project Lead), Greta Bolinger, Tallis Monteiro, Cristina Villalobos-Heredia, Taylor West Summary: Recent studies have...
![Impervious surface imagery derived from Landsat 9 OLI-2 data. This composite was captured over the Finger Lakes region between April and October of 2022. Blue hues indicate dense vegetation while yellow hues indicate impervious areas. Areas in green indicate agricultural fields of interest to NGOs in the region that aim to prevent the conversion of agricultural lands to urban development.](/sites/default/files/styles/lis/public/2024-01/2023Sum_PUP_NewYorkEco_WebsiteImage.jpg.webp?itok=gjo4ogVR)
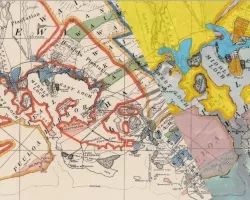
New York Ecological Conservation (Summer 2023) Team: Sam Schulteis (Project Lead), Sam Haas, Stephanie Willsey, Oliver Wilson Summary: Farmland provides ecosystems and communities with services...
![Normalized difference vegetation index (NDVI) calculated from Landsat 8 OLI showing land and aquatic vegetation around the Kankakee River in northeast Illinois on June 9, 2022. For land, dark blue represents high vegetation while light blue represents low vegetation. For water, light orange represents lack of aquatic vegetation, while purple represents the presence of aquatic vegetation. The image shows where along the Kankakee River aquatic vegetation exists.](/sites/default/files/styles/lis/public/2024-01/2023Sum_PUP_KankakeeWater_WebsiteImage.png.webp?itok=9byn7Wpt)
Topic
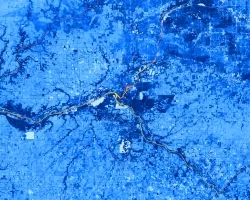
Kankakee Water Resources (Summer 2023) Team: Marisa Smedsrud (Project Lead); Hayden Hoffmeister; Oluwatosin Orimolade; Barira Rashid Summary: In recent years, unpredictable grassing events have occurred...
![NDVI-processed image from Landsat 8 OLI June 2022 data. Black and magenta indicates Portland's built landscape, with the bright magenta depicting the highest concentrations of impervious surfaces. In light pink, the Willamette River dissects the city with surrounding green vegetation. The NDVI conveys areas with high urban build-up with a lack of access to greenspace, illustrating lived experiences of urban heat and contributing to Depave's knowledge of areas that are in most need of depaving.](/sites/default/files/styles/lis/public/2024-01/2023Sum_VEJ_PortlandUrban_WebsiteImage.png.webp?itok=hUDAucTE)
Topic
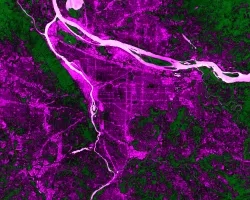
Portland Urban Development (Summer 2023) Team: Keegan Kessler (Project Lead), Hadwynne Gross, Jordan Larson, Adam Nayak Summary: Urban heat is a pressing concern in Portland...
![2022 imagery of 95th percentile Aerosol Optical Depth (AOD) data from Terra/Aqua MODIS mapped against social vulnerability data from the EPA's EJScreen within the San Joaquin Valley's census tracts. Pink indicates higher levels of at-risk populations, and blue indicates higher levels of AOD. Darker shades of blue and purple indicate an overlap of high levels of air pollution and high at-risk population.](/sites/default/files/styles/lis/public/2024-01/2023Sum_VEJ_SanJoaquinValleyHAQ_WebsiteImage.png.webp?itok=RWE-BbSo)
Topic
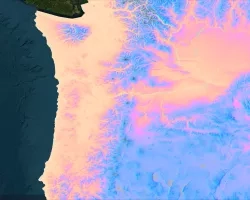
San Joaquin Valley Health & Air Quality (Summer 2023) Team: Jonathan Szeto (Project Lead), Jasper Beardslee, Piper Christian, Bethany MacCarter, Alma Quintero Summary: Little Manila...
![Historic map of the Harbor used in this study.](/sites/default/files/styles/lis/public/2024-02/Nalley_image_0.PNG.webp?itok=kBqbMGaq)
Team: Sandy Ward (Mālama Puʻuloa) Donn Viviani (Leeward Community College) Mia Comeros-Raynal (Water Resources Research Center at the University of Hawaiʻi at Mānoa) Dingyi Liu...
![Census tract map of Corpus Christi and runoff factors.](/sites/default/files/styles/lis/public/2024-02/Zhang_Census-tract%20runoff%20factors%20in%20Corpus%20Christi_80NSSC22K1670.jpg.webp?itok=Z67hHJlZ)
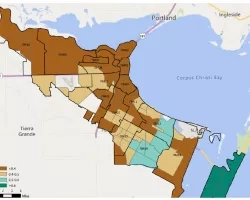
Team: • Jim Lee (Texas A&M University – Corpus Christi), co-I • Yuxia Huang (Texas A&M University – Corpus Christi), co-I • Lapone Techapinyawat (Texas...
Team Members: Miriam Marlier (University of California, Los Angeles), Claire Schollaert (University of Washington), Diane Garcia-Gonzales (University of California, Los Angeles), Michael Jerret (University of...
![Study area and percent poverty by census tract. The zip code and Tucson boundary are from Pima County GIS.](/sites/default/files/styles/lis/public/2024-02/Wolf%20Project%20Page%20Image.png.webp?itok=hRB1p_Q0)
Team Members: Theresa Foley (Sonora Environmental Research Institute), Palmira Henriquez (Sonora Environmental Research Institute), Flor Sandoval (Sonora Environmental Research Institute), Rachel Spitz (Sonora Environmental Research...
![Map of Centreville, IL, and surrounding communities of the American Bottom. Circle area reflects the percent of Black residents in each community. Circle color indicates the number of FEMA flood insurance claims by community. FEMA 100-year flood modeled inundation depths overlain in red, FEMA-reported topographic wetted index reported in light blue. Preliminary HEC-RAS model results, calibrated using community-based monitoring (orange squares for cameras, yellow triangles for pressure transducers) for a 0.5](/sites/default/files/styles/lis/public/2024-02/Masteller%20Project%20Page%20Image.png.webp?itok=e8-AMIVJ)
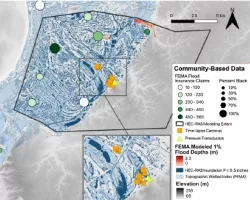
Team Members: Claire Masteller (Washington University), Jose Constantine (Williams College), Hossein Hosseiny (Washington Univeristy in St. Louis) Executive Summary: Low-income and minority communities are often...