Displaying 141 - 150 of 162
![This is a visualization of ECOSTRESS’ Evaporative Stress Index in Marin County, CA. The data is an average of summer months from 2018 – 2022. Scores closer to 0, or red/orange areas, indicate plants are in stress, meaning they are not meeting their potential evapotranspiration, while scores closer to 1, or blue areas, indicate plants are thriving and closer to reaching potential evapotranspiration.](/sites/default/files/styles/lis/public/2023-10/2023Sum_ARC_MarinCountyWildfiresII_WebsiteImage.jpg.webp?itok=pDMrUqyL)
Topic
Marin County Wildland Fires II (2023 Summer) Team: Harrison Raine (Project Lead), Katherine Scott, Nikitha Shivakumar, Tiffany Mar, Anai Tene Summary: A future of increased...
![ACOLITE and NDVI processed imagery from Landsat 9 OLI-2 data. This composite image of the Coos Estuary and surrounding area was taken in September of 2022 after a period of increased precipitation. Shades of blue indicate vegetated land surface. The darker purple indicates higher turbidity while the lighter orange indicates lower turbidity.](/sites/default/files/styles/lis/public/2023-10/2023Sum_ARC_SouthSloughWaterResources_WebsiteImage.jpg.webp?itok=32Kahl4i)
Topic
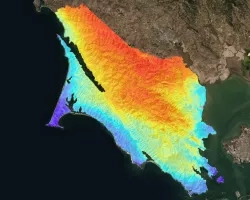
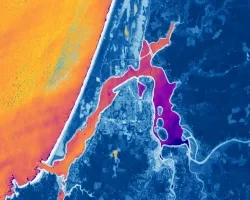
South Slough Water Resources (Summer 2023) Team: Maya Hall (Project Lead), Gabriel Halaweh, Sean McCollum, Zoë Siman-Tov Summary: The Coos estuary in Southern Oregon supports...
![Tasseled Cap Wetness calculated from Landsat 9 OLI-2 imagery from October 25, 2022. The Paria River, shown in dark blue, passes through the landscape. Shades of lighter blue indicate higher values of Tasseled Cap Wetness, with the gradient going towards dark purple and then bright pink for the lowest values of Tasseled Cap. Areas with higher Tasseled Cap Wetness values indicate moister environments, which can enable invasive species proliferation in riparian ecosystems.](/sites/default/files/styles/lis/public/2023-10/2023Sum_CO_PariaRiverEco_WebsiteImage.png.webp?itok=zqBudFvI)
Paria River Ecological Conservation (Summer 2023) Team: Max VanArnam (Project Lead), Wesley Rancher, Truman Anarella, Annie Kowalski Summary: Invasive species within desert riparian environments significantly...
![Predicted cheatgrass green-up imagery from Landsat 8 OLI data. This composite image of the western portion of the Mullen Fire Study Area is from June 2022. Shades of green and yellow indicate an earlier green-up time, while orange, brown, and white areas show later predicted green-up times. This data was used to create NDVI difference maps which will help managers predict when and where to apply treatments to limit the spread of cheatgrass.](/sites/default/files/styles/lis/public/2023-10/2023Sum_CO_SouthernWyomingEcoII_WebsiteImage.jpg.webp?itok=Ht2hUpEj)
Southern Wyoming Ecological Conservation II (Summer 2023) Team: Bryan Graybill (Project Lead), Lillian Gordon, Estelle Lindrooth, Sarah Sathe Summary: Cheatgrass (Bromus tectorum) is an invasive...
![A 3D rendering of Landsat 8 OLI data processed using a Normalized Difference Moisture Index (NDMI). This image of the southeast region of Bandelier National Monument was taken on September 10, 2022. The Rio Grande is shown on the right side in dark purple, with upland areas shown in light green. NDMI highlights the areas of high moisture content, around which vegetation is more prevalent, as seen in indigo.](/sites/default/files/styles/lis/public/2023-10/2023Sum_GA_BandelierEco_WebsiteImage.jpg.webp?itok=md4A-bjs)
Bandelier Ecological Conservation (Summer 2023) Team: van Barrett (Project Lead), Megan Rich, Nusrat Zahan Jarin, Chloe Johnson Summary: The Southwest U.S. has experienced a growth...
![Normalized Difference Water Index (NDWI) to visualize drainage networks around the Unalakleet River in Alaska, calculated from an August 2021 Landsat 8 OLI image. Yellow represents standing or flowing water and potential flood zones, while the dark blue represents drier, upland regions. Unalakleet's climate resilience planning prioritizes relocation to upland regions while avoiding areas that have experienced significant permafrost degradation.](/sites/default/files/styles/lis/public/2023-10/2023Sum_GA_UnalakleetClimate_WebsiteImage.jpg.webp?itok=9m9RUwoB)
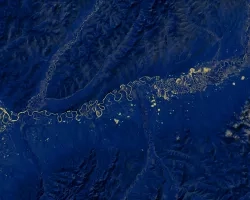
Unalakleet Climate (Summer 2023) Team: Ian Lee (Project Lead), Clara Maxwell, Daniel J. Marsden, M. Jaweed Nazary Summary: The coastal community of Unalakleet is currently...
![Runoff retention values in Richmond, VA estimated by the InVEST Urban Flood Risk Mitigation Model for a June 2, 2018, extreme rainfall event measured by GPM IMERG. Dark blue areas have high runoff retention capacity and absorbed more of the rainfall during the storm; light green areas absorbed less rainfall during the storm, increasing the likelihood of pluvial flooding. Pluvial flood risk maps help inform community planners’ efforts to protect vulnerable populations.](/sites/default/files/styles/lis/public/2023-11/2023Sum_LaRC_RichmondDisasters_WebsiteImage.jpg.webp?itok=17L81iXz)
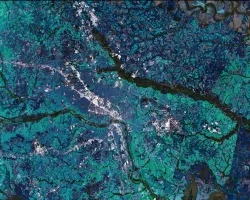
Richmond Disasters (Summer 2023) Team: Kaylee Tanner (Project Lead), Brodie Thiele, Trinity Johnson, Maggie Lincoln Summary: Pluvial flooding is the most frequent and widespread type...
Topic
This project explores the potential of Remote Sensing (RS) and spatial data to advance Environmental Justice, with a focus on tribal land and water resources...
![Chlorophyll-a imagery from Aqua MODIS for March 2022 in the Gulf of Maine. Simulated PACE OCI data are derived from Aqua MODIS. Areas in red have a high chlorophyll-a concentration, meaning that the water is high in nutrients such as nitrogen and phosphorus, which cause algae to grow. Areas in blue have a low chlorophyll-a concentration, so the conditions are not present for harmful algal blooms.](/sites/default/files/styles/lis/public/2024-01/2023Sum_GSFC_PACEWater_WebsiteImage.jpg.webp?itok=_PCfcx9Q)
Topic
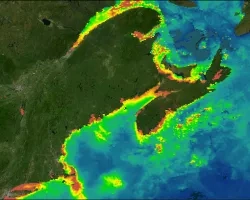
PACE Water Resources (Summer 2023) Team: Jules Kourelakos, Isabel Lubitz, Matt Romm, Grace Thorpe Summary: This project aimed to develop tools to support the future...
![NDVI-processed imagery from Landsat 8 OLI/TIRS data. This composite image of Washington, D.C., and the surrounding area representing max green values over the summer months of 2022. Blue shades in the image represent vegetated areas, while green and yellow shades represent water and areas with no vegetation. Plant cover has a major impact on water quality, making it crucial for the National Park Service to understand the state of vegetation in this region.](/sites/default/files/styles/lis/public/2024-01/2023Sum_GSFC_PotomacRiverBasinWater_WebsiteImage.png.webp?itok=6F3K9dyn)
Topic
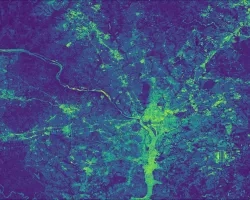
Potomac River Basin Water Resources (Summer 2023) Team: Zach Kinloch, Divina Lade, Xavier García López, Haydee Portillo Summary: The Potomac River Basin (PRB) is responsible...