Displaying 101 - 110 of 162
![NDVI-processed imagery taken by Landsat 9 OLI-2 in May 2022 of Bryce Canyon National Park and nearby urban area. Healthy vegetation are visualized as bright yellow, while stressed plants, bare earth, and urban areas approach dark red. The continuity of the Landsat program described vegetation response to pervasive drought conditions in Bryce Canyon which the National Park Service can use to when making conservation decisions.](/sites/default/files/styles/lis/public/2023-02/2022Fall_GSFC_BryceCanyonWaterResources_WebsiteImage.png.webp?itok=mswmR89-)
Bryce Canyon Water Resources (Fall 2022) Team: Aaron Carr (Project Lead), Mel Frost, Alissa Stark, Ashley Grinstead Summary: Bryce Canyon National Park is home to...
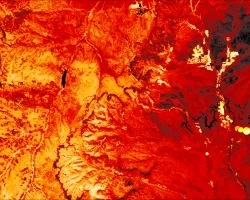
Idaho Wildfires II (Fall 2022) Team: Talissa Cota (Project Lead), Dana Drinkall, Ryan Healey, Tyler Morvant Summary: The western United States has experienced twenty years...
![We created an averaged seasonal Evaporative Stress Index (ESI) composite for fall 2020 in the west Tennessee region utilizing NASA’s ECOSTRESS sensor onboard the International Space Station. The ESI reveals areas where vegetation is stressed due to lack of water. Dark blue regions represent areas where vegetation is thriving, compared to the yellow areas, where vegetation is experiencing some water stress.](/sites/default/files/styles/lis/public/2023-02/2022Fall_JPL_WesternTNWater_WebsiteImage.jpg.webp?itok=BhQQZWBf)
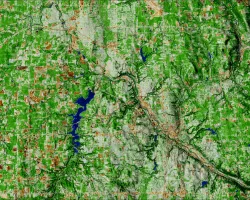
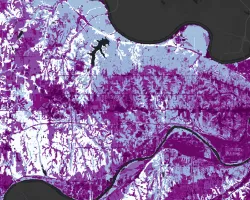
Western Tennessee Water Resources (Fall 2022) Team: Lauren Webster (Project Lead), Elena Pilch, Michael Pazmino, Katera Lee Summary: The Memphis Aquifer (MA) is located in...
![Google Earth Engine processed off-shore imagery in the Gulf of Mexico. The image was captured by NASA Earth observations satellite Landsat 9 OLI on March 9, 2022. Colors correspond to fractional reflectance values derived from a multi-band-multi-pass method for detecting methane absorption across bands 6 and 7.](/sites/default/files/styles/lis/public/2023-02/2022Fall_JPL_GMHAQII_WebsiteImage.png.webp?itok=Waojjr-w)
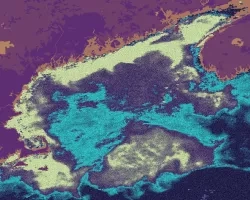
Gulf of Mexico Health & Air Quality II (Fall 2022) Team: Ben Dahan (Project Lead), Melodi Hess, Rene Castillo, Vanessa Machuca Summary: Offshore oil and...
![NDTI-processed imagery from Landsat 8 OLI data. This image from October 2021 depicts the turbidity of Keweenaw Bay, western Michigan coastline of Lake Superior. Light blue-colored water indicates greater turbidity while darker blue water is less turbid. Turbid waters indicate coastal erosion and re-distribution of legacy copper mining waste colloquially referred to as "stamp sands". Stamp sands contaminate wetlands and threaten traditional food sources for Indigenous communities along the bay.](/sites/default/files/styles/lis/public/2023-02/2022Fall_LaRC_KeweenawBayWater_WebsiteImage.jpg.webp?itok=J-ICa-DH)
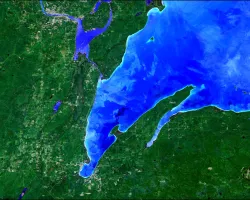
Keweenaw Bay Water Resources (Fall 2022) Team: Khaim Syed-Raza (Project Lead), Sofia Vahutinsky, Lisa Siewart, Nora Whitelaw-McDonald Summary: The Keweenaw Bay Indian Community (KBIC) has...
![NDBI-processed imagery from a June 2022 Landsat 9 OLI-2 image. This composite image shows the cities of Warren (top left) and Youngstown (bottom right). The areas in white and brown represent the built environment. While areas in green represent land that is not as built-up, such as forest. Built-up areas can indicate where surface run off could occur, resulting in pluvial flooding.](/sites/default/files/styles/lis/public/2023-02/2022Fall_LaRC_YoungstownWarrenDisasters_WebsiteImage.jpg.webp?itok=EkdUM8uk)
Youngstown & Warren Disasters (Fall 2022) Team: Lauren Mahoney (Project Lead), David Henriques, Nada Haddad, Thomas Ferrell Summary: Both pluvial and fluvial flooding events pose...
![Aph(433)-processed imagery from merged Aqua MODIS and Sentinel-3 data. This image of the Gulf of Maine was taken on September 12, 2016 during one of the most severe harmful algal bloom events. Using in-situ data, it was determined that Pseudo-nitzschia was a dominant genus of algae present at the time of the bloom. Shades of bright green indicate peak absorption by phytoplankton and aph(433) is corrected for false positive absorption indications.](/sites/default/files/styles/lis/public/2023-02/2022Fall_MA_GulfofMaineWater_WebsiteImage.jpg.webp?itok=CezSF3AF)
Gulf of Maine Water Resources (Fall 2022) Team: Suhani Dalal (Project Lead), Lily Gray, Yixuan Li, Jane Zugarek Summary: The Gulf of Maine has a...
![Stormwater retention across Wyandotte County, Kansas. NASA GPM IMERG data for September 2020 – August 2021 and NLCD 2019 Land Cover data were used as model inputs for the InVEST Stormwater Retention Model. One model output included a stormwater retention ratio layer where darker purple values indicate poor stormwater retention and increased flood risk. Areas of poor stormwater retention can then be identified as priority regions for Green Infrastructure initiatives in Wyandotte County.](/sites/default/files/styles/lis/public/2023-02/2022Fall_MA_KansasCityDisastersII_WebsiteImage.png.webp?itok=sqRBpysQ)
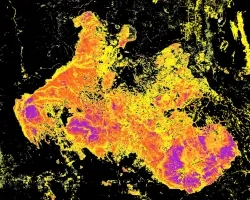
Kansas City Disasters II (Fall 2022) Team: Nora Carmody (Project Lead), Dain Kim, Kameron Lloyd, Ruby Nagelberg Summary: In pluvial flood events, stormwater runoff can...
![Normalized burn ratio calculated from Landsat 8 imagery both preceding and following the Bootleg Wildfire in the Beatty, Oregon area. The fire burned from July 6th to August 15th during the Summer of 2021 and its footprint shows varying levels of burn severity. Dark purple areas indicate highest severity, shades of red and orange indicate moderate severity, and yellow areas indicate low burn severity. Black areas depict unburned areas.](/sites/default/files/styles/lis/public/2023-02/2022Fall_NC_Gatlinburg%26BeattyWildfires_WebsiteImage.jpeg.webp?itok=_JPQMuhI)
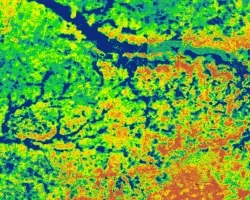
Gatlinburg & Beatty Wildfires (Fall 2022) Team: Kelli Roberts (Project Lead), William Hadley, Daniel Littleton Summary: Wildfire potential monitoring, which is increasingly vital under climate...
![Landsat 8 OLI data processed into the median NDVI for 2016-2021 with an overlay showing deforestation that occurred during this time period in the Talladega National Forest. The deforestation layer is derived from Global Forest Watch's forest cover data, which uses the Landsat series, and was calculated as the difference between forested areas in 2016 and forested areas in 2021. Shades of green indicate the density of forest, while red areas indicate areas deforested in 2021.](/sites/default/files/styles/lis/public/2023-02/2022Fall_PUP_SoutheastUSClimate_WebsiteImage.jpeg.webp?itok=9thA-LxI)
Topic
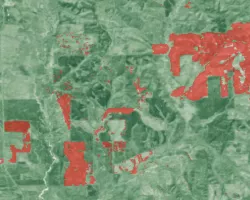
Southeast US Climate (Fall 2022) Team: Heidi Rogers (Project Lead), Mistaya Smith, Maggie Mason, Anish Holla Summary: Deforestation, a significant contributor to carbon emissions, is...