Displaying 21 - 30 of 35
![NDTI-processed river imagery from 2021 PlanetScope data with GPM IMERG data shown in blue. The Shoshone River in northwestern Wyoming is shown with red values indicating lower turbidity and yellow values representing higher turbidity. Lighter blue values indicate higher monthly mean IMERG precipitation values for 2021. NDTI values and precipitation averages help watershed managers understand where and when excess sediment enters the river.](/sites/default/files/styles/lis/public/2023-02/2022Fall_PUP_ShoshoneRiverWater_WebsiteImage.jpg.webp?itok=myaPr9UA)
Shoshone River Water Resources (Fall 2022) Team: Robyn Holmes (Project Lead), Will Campbell, Cassie Ferrante, Nelson Lemnyuy Summary: In 2016, a routine repair operation at...
![Land cover imagery processed from Landsat 8 OLI and ocean turbidity data imagery processed from Sentinel-2 MSI. The Tijuana River stormwater plume off the San Diego coast was mapped from data collected on December 5th, 2019, while the land surface data was collected on April 4th, 2022. Shades of red indicate high turbidity values, while blue areas show normal turbidity values. Areas of high turbidity reflect high concentration of pollutants from stormwater runoff.](/sites/default/files/styles/lis/public/2023-02/2022Fall_ARC_SanDiegoWaterResources_WebsiteImage.jpg.webp?itok=Z3fy2AmA)
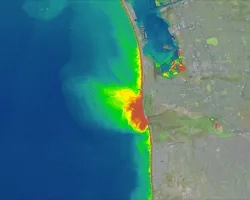
San Diego Water Resources (FALL 2022) Team: Ethan Gates (Project Lead), Stefanie Mendoza, Jonathan Szeto, Max VanArnam Summary: Stormwater and wastewater runoff are a large...
![NDVI-processed imagery taken by Landsat 9 OLI-2 in May 2022 of Bryce Canyon National Park and nearby urban area. Healthy vegetation are visualized as bright yellow, while stressed plants, bare earth, and urban areas approach dark red. The continuity of the Landsat program described vegetation response to pervasive drought conditions in Bryce Canyon which the National Park Service can use to when making conservation decisions.](/sites/default/files/styles/lis/public/2023-02/2022Fall_GSFC_BryceCanyonWaterResources_WebsiteImage.png.webp?itok=mswmR89-)
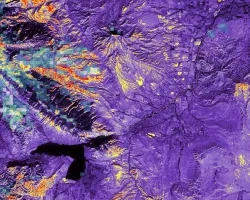
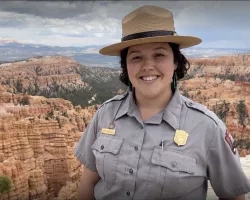
Bryce Canyon Water Resources (Fall 2022) Team: Aaron Carr (Project Lead), Mel Frost, Alissa Stark, Ashley Grinstead Summary: Bryce Canyon National Park is home to...
![We created an averaged seasonal Evaporative Stress Index (ESI) composite for fall 2020 in the west Tennessee region utilizing NASA’s ECOSTRESS sensor onboard the International Space Station. The ESI reveals areas where vegetation is stressed due to lack of water. Dark blue regions represent areas where vegetation is thriving, compared to the yellow areas, where vegetation is experiencing some water stress.](/sites/default/files/styles/lis/public/2023-02/2022Fall_JPL_WesternTNWater_WebsiteImage.jpg.webp?itok=BhQQZWBf)
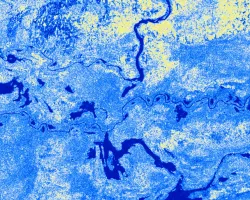
Western Tennessee Water Resources (Fall 2022) Team: Lauren Webster (Project Lead), Elena Pilch, Michael Pazmino, Katera Lee Summary: The Memphis Aquifer (MA) is located in...
![NDTI-processed imagery from Landsat 8 OLI data. This image from October 2021 depicts the turbidity of Keweenaw Bay, western Michigan coastline of Lake Superior. Light blue-colored water indicates greater turbidity while darker blue water is less turbid. Turbid waters indicate coastal erosion and re-distribution of legacy copper mining waste colloquially referred to as "stamp sands". Stamp sands contaminate wetlands and threaten traditional food sources for Indigenous communities along the bay.](/sites/default/files/styles/lis/public/2023-02/2022Fall_LaRC_KeweenawBayWater_WebsiteImage.jpg.webp?itok=J-ICa-DH)
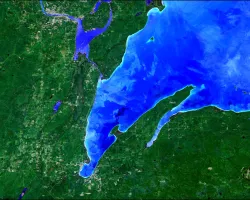
Keweenaw Bay Water Resources (Fall 2022) Team: Khaim Syed-Raza (Project Lead), Sofia Vahutinsky, Lisa Siewart, Nora Whitelaw-McDonald Summary: The Keweenaw Bay Indian Community (KBIC) has...
![Aph(433)-processed imagery from merged Aqua MODIS and Sentinel-3 data. This image of the Gulf of Maine was taken on September 12, 2016 during one of the most severe harmful algal bloom events. Using in-situ data, it was determined that Pseudo-nitzschia was a dominant genus of algae present at the time of the bloom. Shades of bright green indicate peak absorption by phytoplankton and aph(433) is corrected for false positive absorption indications.](/sites/default/files/styles/lis/public/2023-02/2022Fall_MA_GulfofMaineWater_WebsiteImage.jpg.webp?itok=CezSF3AF)
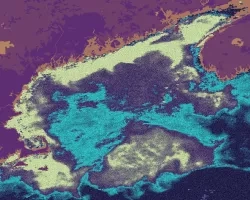
Gulf of Maine Water Resources (Fall 2022) Team: Suhani Dalal (Project Lead), Lily Gray, Yixuan Li, Jane Zugarek Summary: The Gulf of Maine has a...
![The satellite imagery is a Sentinel-1 Ground Range Detection C-SAR image from July 2nd, 2021, taken over the Sudd Wetland located in South Sudan. The image shows the 'VV' backscatter values, which correlate to vertical transmission and vertical reception from the C-SAR instrument and are used to classify wetland inundation extent. Low 'VV' values (blue) represent areas covered by open waters & inundated land areas and high 'VV' values (yellow) represent dry land areas.](/sites/default/files/styles/lis/public/2023-05/2023Spring_JPL_WETWater_WebsiteImage.jpg.webp?itok=UViLBf_D)
Topic
WET Water Resources (2023 Spring) Team: Lori Berberian (Project Lead), Kaely Harris, Mitch Porter, Emma Waugh Summary: Wetland ecosystems are annually or seasonally wet transition...
![Normalized Difference Snow Index (NDSI) processed image using Landsat 8 OLI data from January 2022 and SUOMI-NPP VIIRS snow cover data from January 2019, overlaid on a Landsat 8 RGB image, colorized purple. NSDI is shown in yellow-orange-red and SUOMI-NPP VIIRS is depicted in shades of blue. Snow cover data was used to identify melt events causing high turbidity in Wyoming’s Shoshone River basin. PlanetScope-derived turbidity (May 2019) also highlights the river in green.](/sites/default/files/styles/lis/public/2023-05/2023Spring_PUP_ShoshoneWaterII_WebsiteImage.jpg.webp?itok=YMzk_JP6)
Topic
Shoshone River Water Resources II (2023 Spring) Team: Robyn Holmes (Project Lead), Christian Bitzas, Jillian Greene, Isabella St. John Summary: The Willwood Dam, an irrigation...
![Color composite image portraying Wupatki Basin in northwestern Arizona, derived from 2021 LANDSAT 8 OLI/TIRS imagery. This image depicts Pinyon-Juniper Woodlands (PJW), among other vegetation, between the river and mountains in a light green color. Thermal Infrared (TIR) occupies the red band, while the green and blue bands represent the Modified Normalized Difference Water Index (MNDWI) and the Modified Soil-Adjusted Vegetation Index (MSAVI), respectively. The reduced correlation between bands in this comp](/sites/default/files/styles/lis/public/2023-05/2022Fall_GSFC_ArizonaWaterII_WebImage.jpg.webp?itok=yVrQqur8)
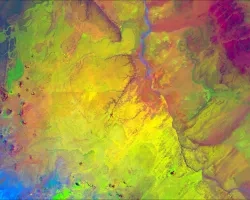
Arizona Water Resources II (Fall 2022) Team: Arina Morozova (Project Lead), Jamal Jeffer, Jessica Birk, Greg Peargin Summary: Pinyon-juniper woodlands (PJW) provide critical and resilient...
DEVELOP
Wildland Fires
Climate
Capacity Building
Ecological Conservation
Health & Air Quality
Water Resources