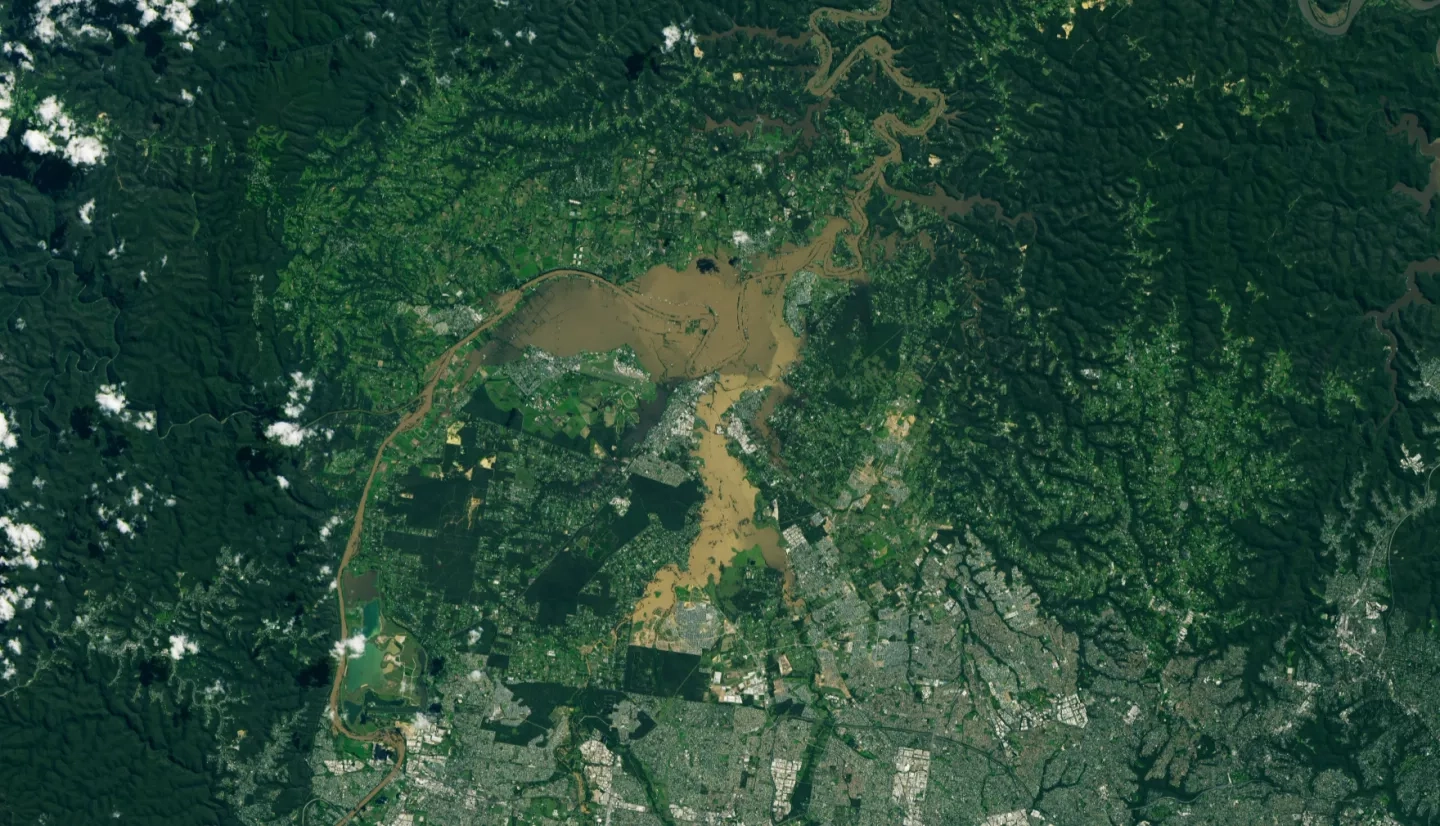
Persistent, heavy rain fell for several days in late March 2021 in New South Wales, Australia, leading to the region’s worst flooding in six decades. The Australian Bureau of Meteorology (BOM) reported that areas around Sydney and in the Hunter and Mid North Coast regions were drenched with 400 to 600 millimeters (16 to 24 inches) of rain across four days, which is in-line with NASA satellite-based estimates of the precipitation.
The above animation shows estimated precipitation rates and accumulations from NASA’s Integrated Multi-satellitE Retrievals for GPM (IMERG). Liquid-equivalent precipitation rates (blue/yellow shading) and accumulations (green shading) at half-hourly intervals from March 16 - 23, 2021, are shown overlaid on shades of white/gray from NOAA infrared satellite cloud data. Credits: NASA
In its role to advance applied research for risk reduction, response and recovery for floods and other disasters, the NASA Earth Science Applied Sciences Disasters program area has activated to monitor the Australia floods. The Program is assessing the impact of the floods by developing maps and other data products, and reaching out to regional stakeholders to assess needs, identify potential areas of collaboration, and demonstrate the capabilities of remote sensing and its application to flooding events.
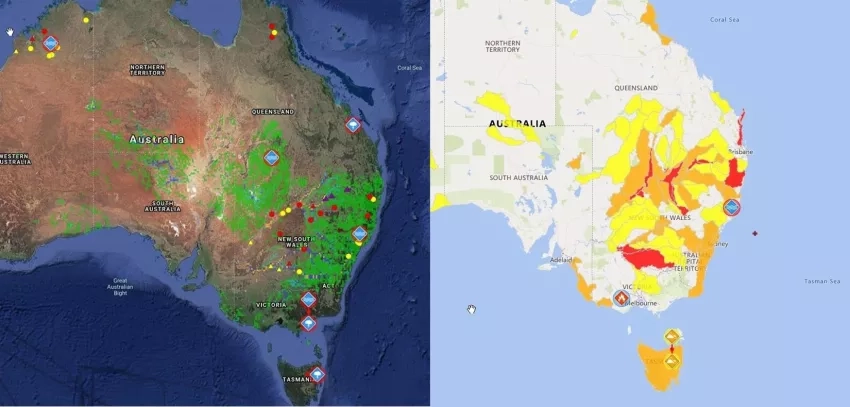
The above two images show estimated flood severity for the Australia flooding event in March 2021 developed by the A.37 ROSES research project Advancing Access to Global Flood Modeling and Alerting using the PDC DisasterAWARE® Platform and Remote Sensing Technologies. In the left image, green areas show likely flooded regions as identified by the GFMS global flood model, while the red, yellow, and purple points are outputs from the GloFAS global flood model. These two model outputs were then integrated into a “model of models” to produce the watershed level flood severity alert (red, orange, yellow, green), shown in the right image. The PDC DisasterAWARE platform then ingests and deploys these data to aid a global community of end-users who use it to make informed disaster response decisions.
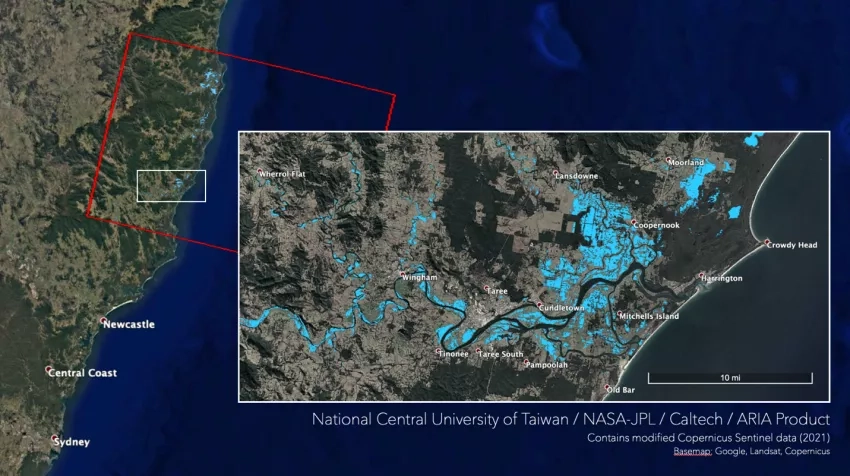
The A.37 ROSES research project Global Rapid Damage Mapping System with Spaceborne SAR Data developed the above flood proxy map in collaboration with ARIA and by the National Central University of Taiwan. The map shows areas of the Mid North Coast region that were likely to be flooded (indicated in blue) on March 20, 2021. The maps were derived from synthetic aperture radar (SAR) data acquired by the Copernicus Sentinel-1 satellites, operated by the European Space Agency (ESA).
Other Applied Sciences projects supporting the research activation include:
- ROSES A.50 Global Rapid Flood Mapping Project
- ROSES A.37 Open Critical Infrastructure Exposure for Disaster Forecasting, Mitigation and Response
- ROSES A.37 Hail Storm Risk Assessment Using Space-Borne Remote Sensing Observations and Reanalysis Data
- ROSES A.37 Coupled Interactive Forecasting of Weather, Fire Behavior, and Smoke Impact for Improved Wildland Fire Decision Making
- ROSES A.37 Integrating SAR Data for Improved Resilience and Response to Weather-Related Disasters Project
NASA Resources:
External Resources: