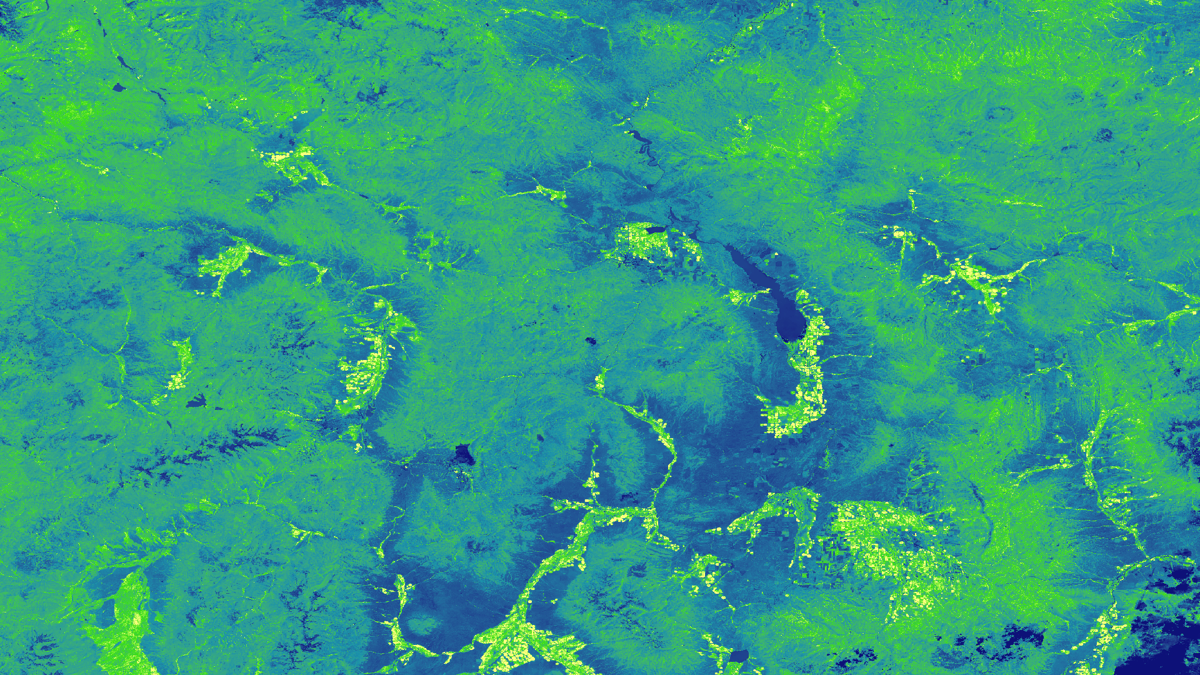
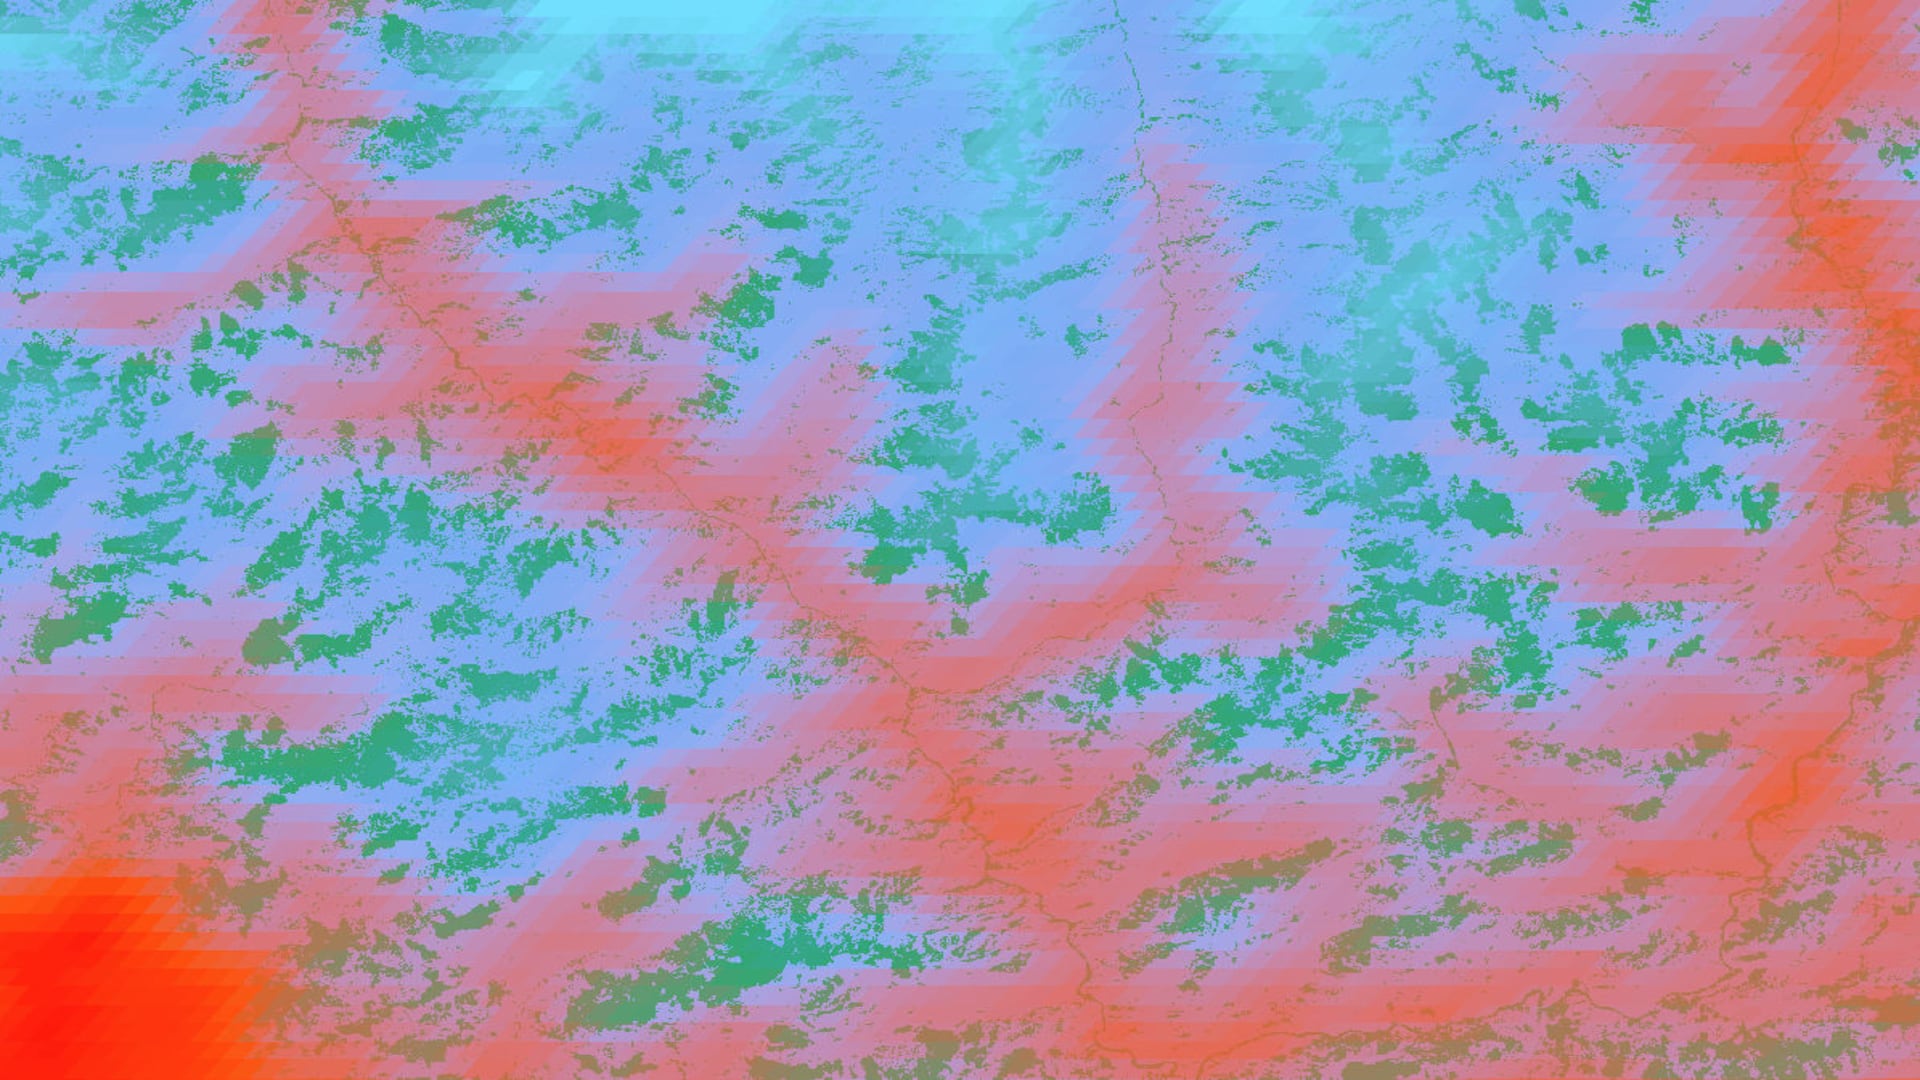
Principal Investigator

Scott Harrison

Imagen
Compilation of processed provisional land surface temperature data from 1990-2019 acquired by Landsat 4-8. The City of New York, located in Southeast New York State is displayed. Blue hues represent areas where temperatures are less than the average mean. Orange to red hues show areas equal to or higher than the mean temperature. Areas in red are hotspots within the city. These are areas where policymakers should focus green initiatives on to reduce extreme heat.  Keywords: Landsat, Urban Heat, Hotspots, New York City, Extreme Weather

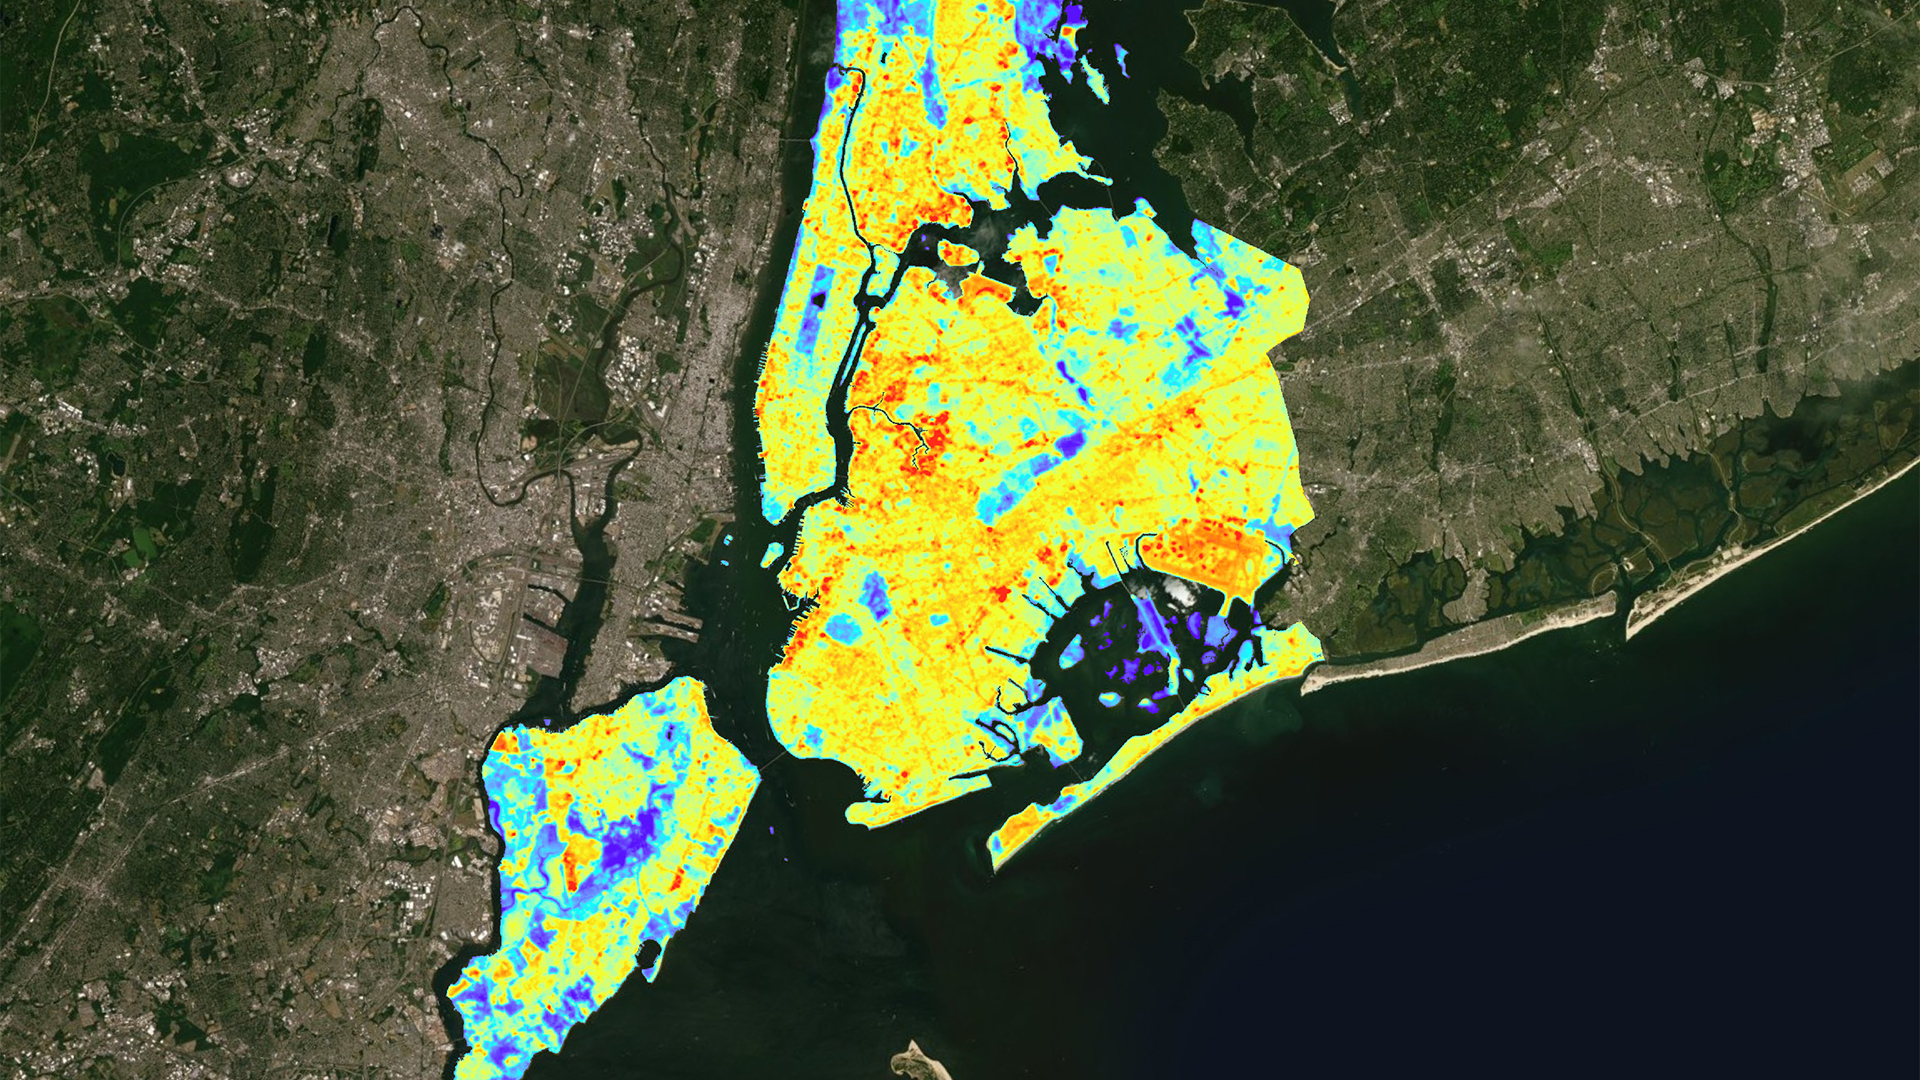
The effect of urban hotspots is a growing public health concern. In the face of climate change and urbanization, city dwellers are at increasing risk for heat-related illness and mortality. New York City (NYC) is especially vulnerable to heat-related illness...

Principal Investigator

Chiara Phillips

Imagen
NDVI-processed Landsat 8 OLI data over the Lower Omo River Valley on January 11th, 2018. Lighter colors indicate areas with high vegetation greenness while darker colors indicate less green vegetation and water. This will help decision-makers understand where agricultural areas are located in comparison to uncultivated lands.  Keywords: remote sensing, Landsat, Normalized Difference Vegetation Index, Tasseled Cap, agro-business, land cover change

Ethiopia is home to unique wildlife, biodiversity, and ecosystem services and, like much of the world, is undergoing population growth, development, and land use change. As a result, some biodiverse regions may be at risk of being urbanized, cultivated as...

Principal Investigator

Sarah Aldama

Imagen
Average GPM IMERG data (2018) combined with landslide susceptibility calculated using SRTM imagery (2000) serve as inputs for the Landslide Hazard Assessment for Situational Awareness (LHASA) model for the Dominican Republic Cordillera Central mountain range. This LHASA “nowcast” respectively shows high and moderate landslide potential in red and yellow, as well as high to low susceptibility to rainfall-triggered landslides in dark and light orange. With LHASA nowcasts, landslide hazard can be assessed in near real-time.

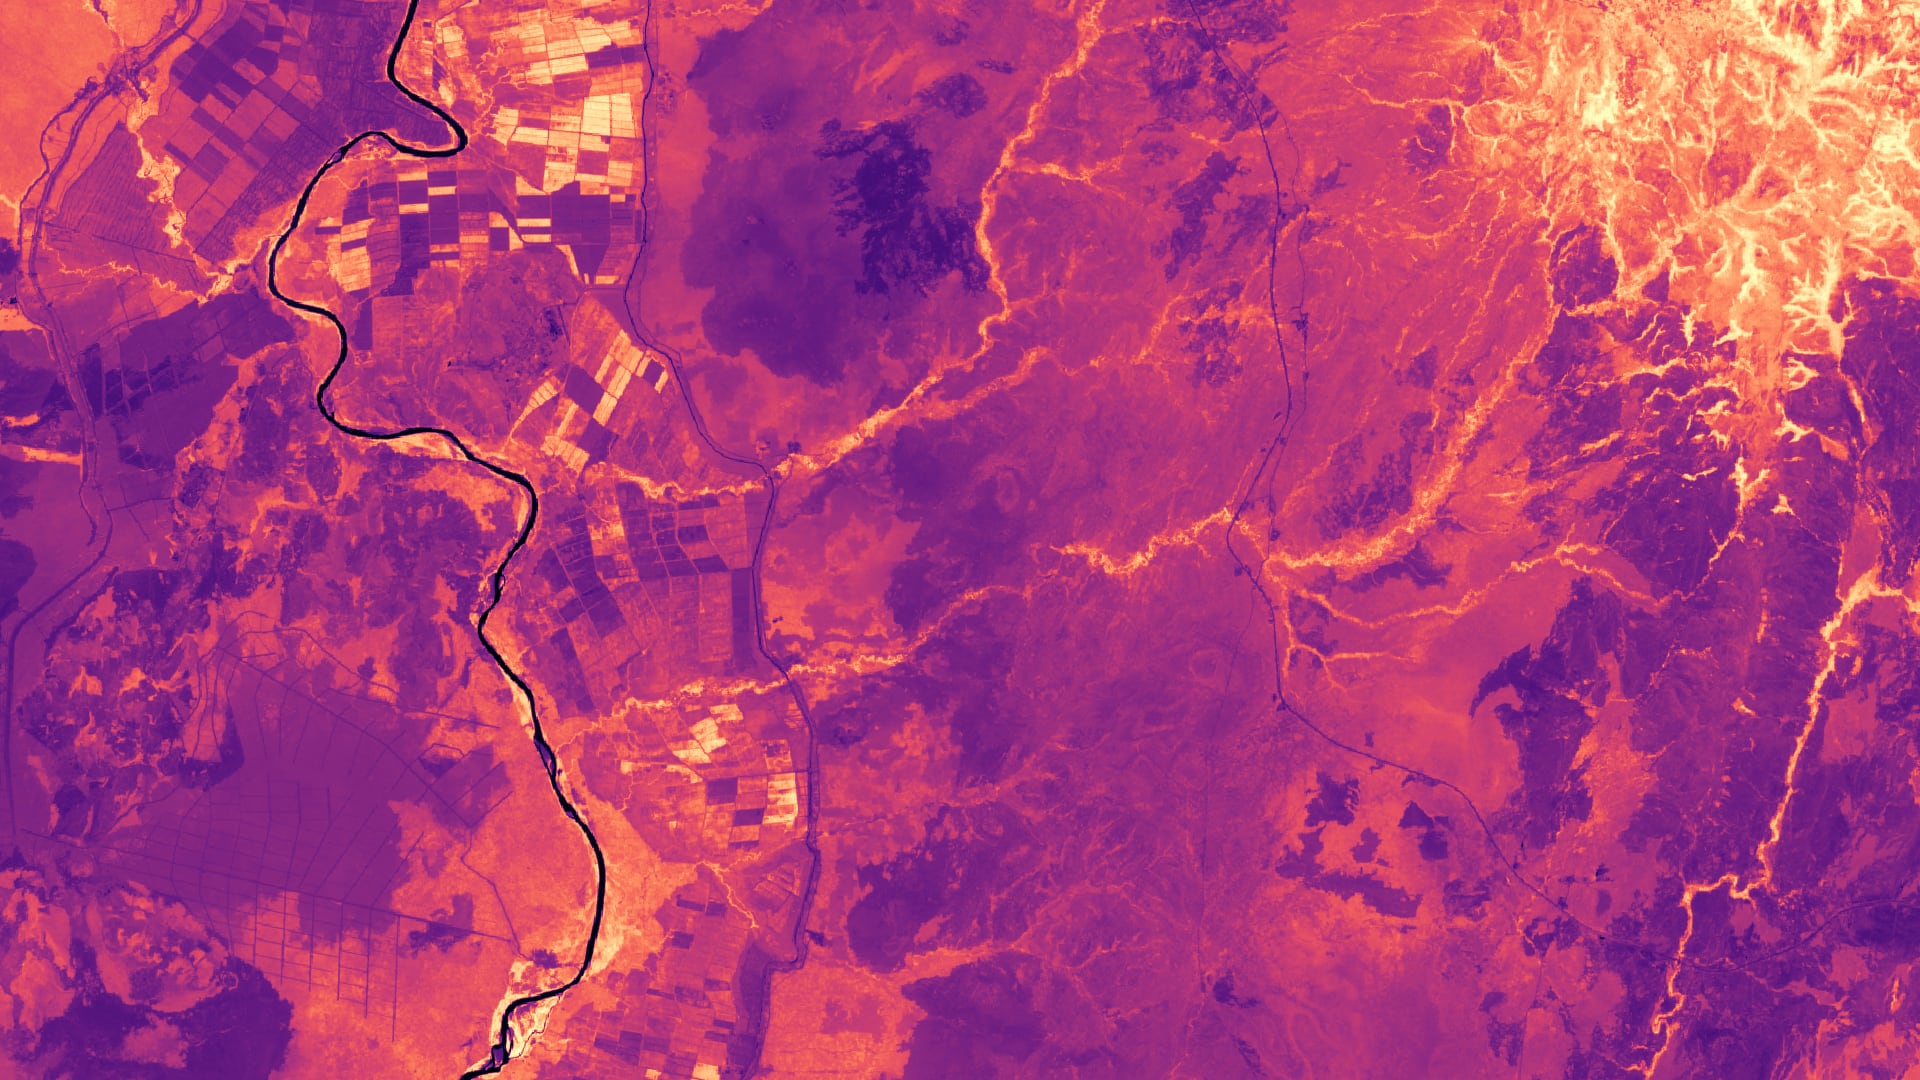
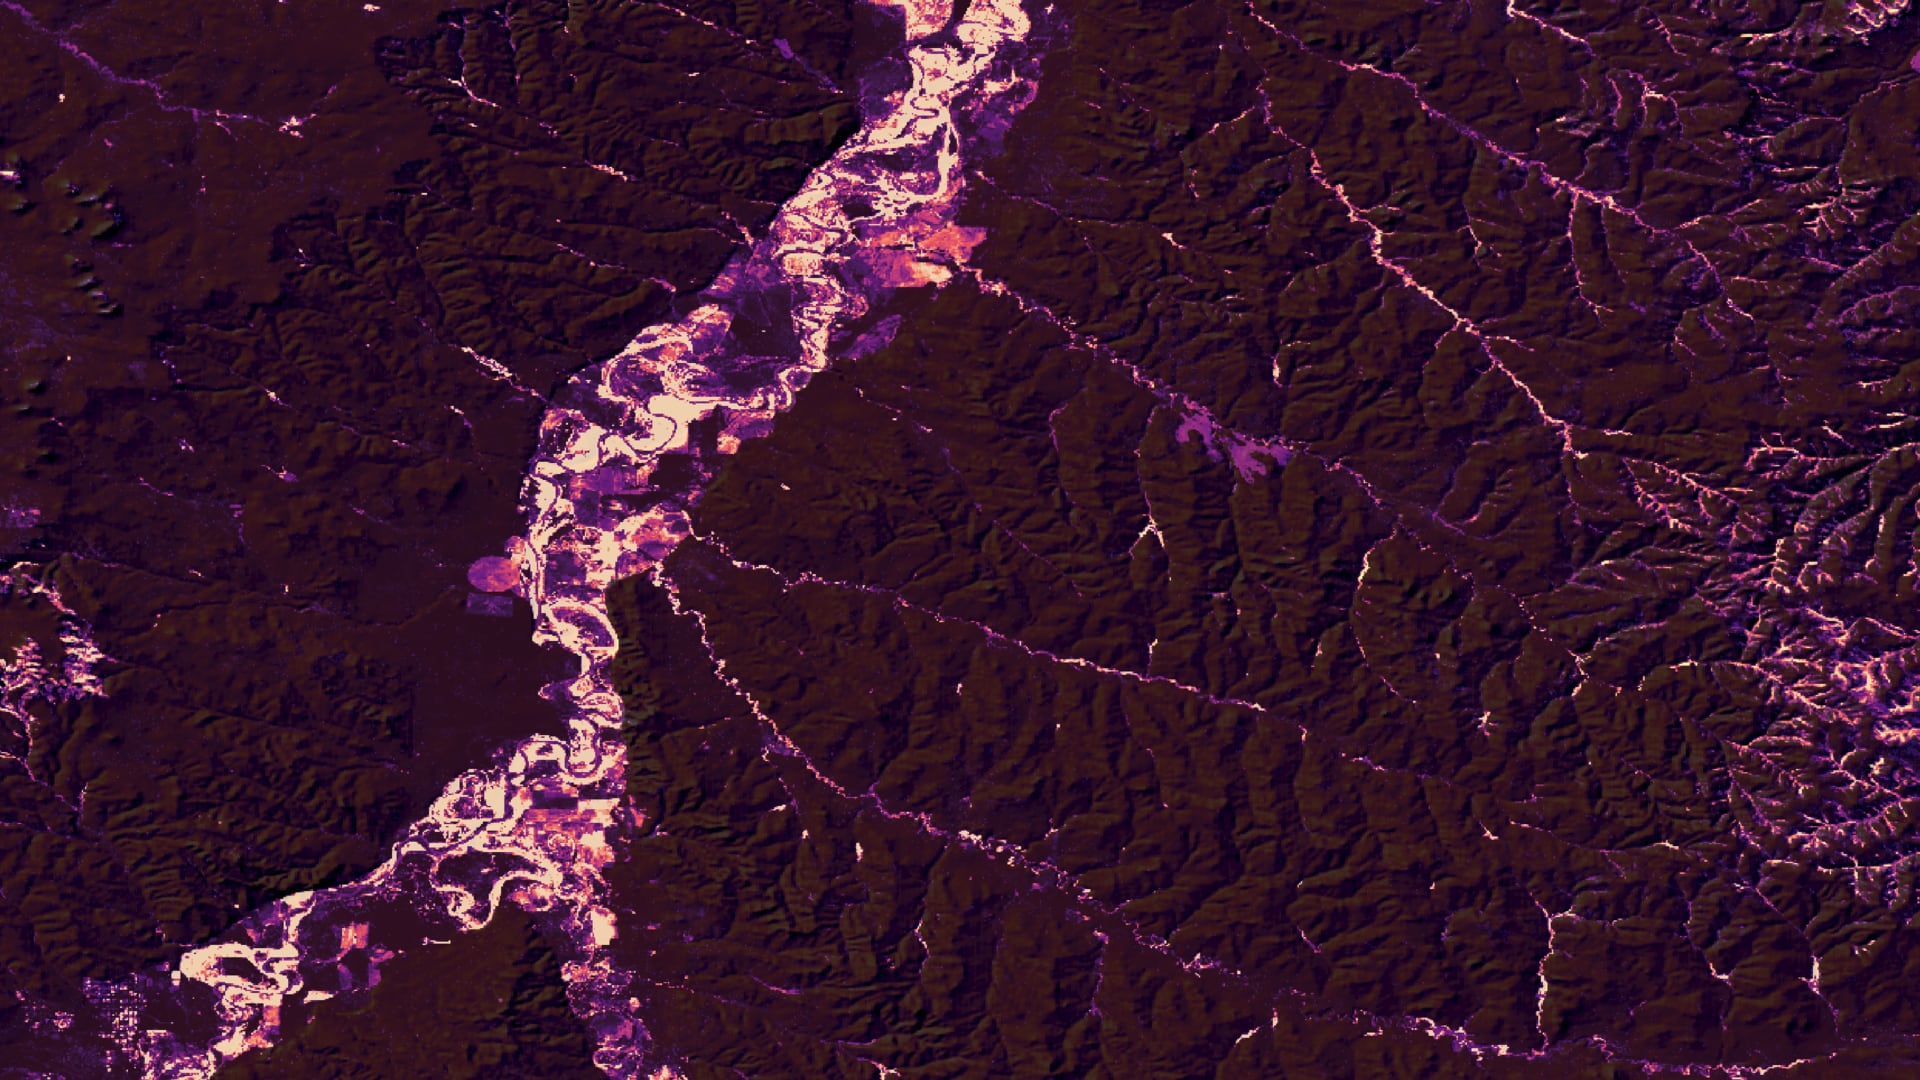
Rainfall-triggered landslides associated with tropical storms cause devastating damage to the communities in the Dominican Republic and surrounding Caribbean islands. With the predicted increase in the frequency and intensity of storms, the region would benefit from reliable disaster monitoring. Partnering...

Principal Investigator

Catherine Buczek

Imagen
A Russian olive (RO) detection map created using 2020 Sentinel-2 MSI and 2020 Landsat 8 OLI imagery overlayed by a hillshade layer created by the Team from a series of USDA NRCS DEMs. The central portion of the Powder River is displayed. Yellow-white (purple-black) colors indicate RO presence (absence) in percent. There is no threshold on the results displayed; therefore, it is not an accurate representation of the results of our RO detection model.  Keywords: random forest model, russian olive, sentinel, landsat, shahin, courtney, tian, andrews, buczek

Since its introduction in the late 1800s, Russian olive (Elaeagnus augustifolia) has become a widespread invasive shrub that poses a threat to native riparian species in the United States that directly competes with native riparian plants for space and resources...

Principal Investigator

Sarah Wingard

Imagen
A Tassled-Cap Transformation was applied to a Landsat-8 OLI satellite image of the Apostle Island National Lakeshore from August 13, 2018, in western Lake Superior. In the above image, a red color gun was applied to the ‘Greeness’ band to highlight chlorophyll within surface water, represented as cyan in the image. Applying the blue and green color guns to the ‘Wetness’ band distinguishes land and non-photosynthetic lake water, characterizing land as red and non-photosynthetic water as purple.  Keywords: Apostle Islands, Lake Superior

Perceived increases in the occurrence of sediment plumes and algal blooms following storm events have raised concerns about water quality within western Lake Superior. Increases in algal productivity and suspended sediment concentration may have negative impacts on wildlife, human health...

Principal Investigator

Brendan McAndrew

Imagen
Mapping Treeline Rise and Wetland Conversion in order to Supplement Resource Management Actions in a Changing Alaskan Climate

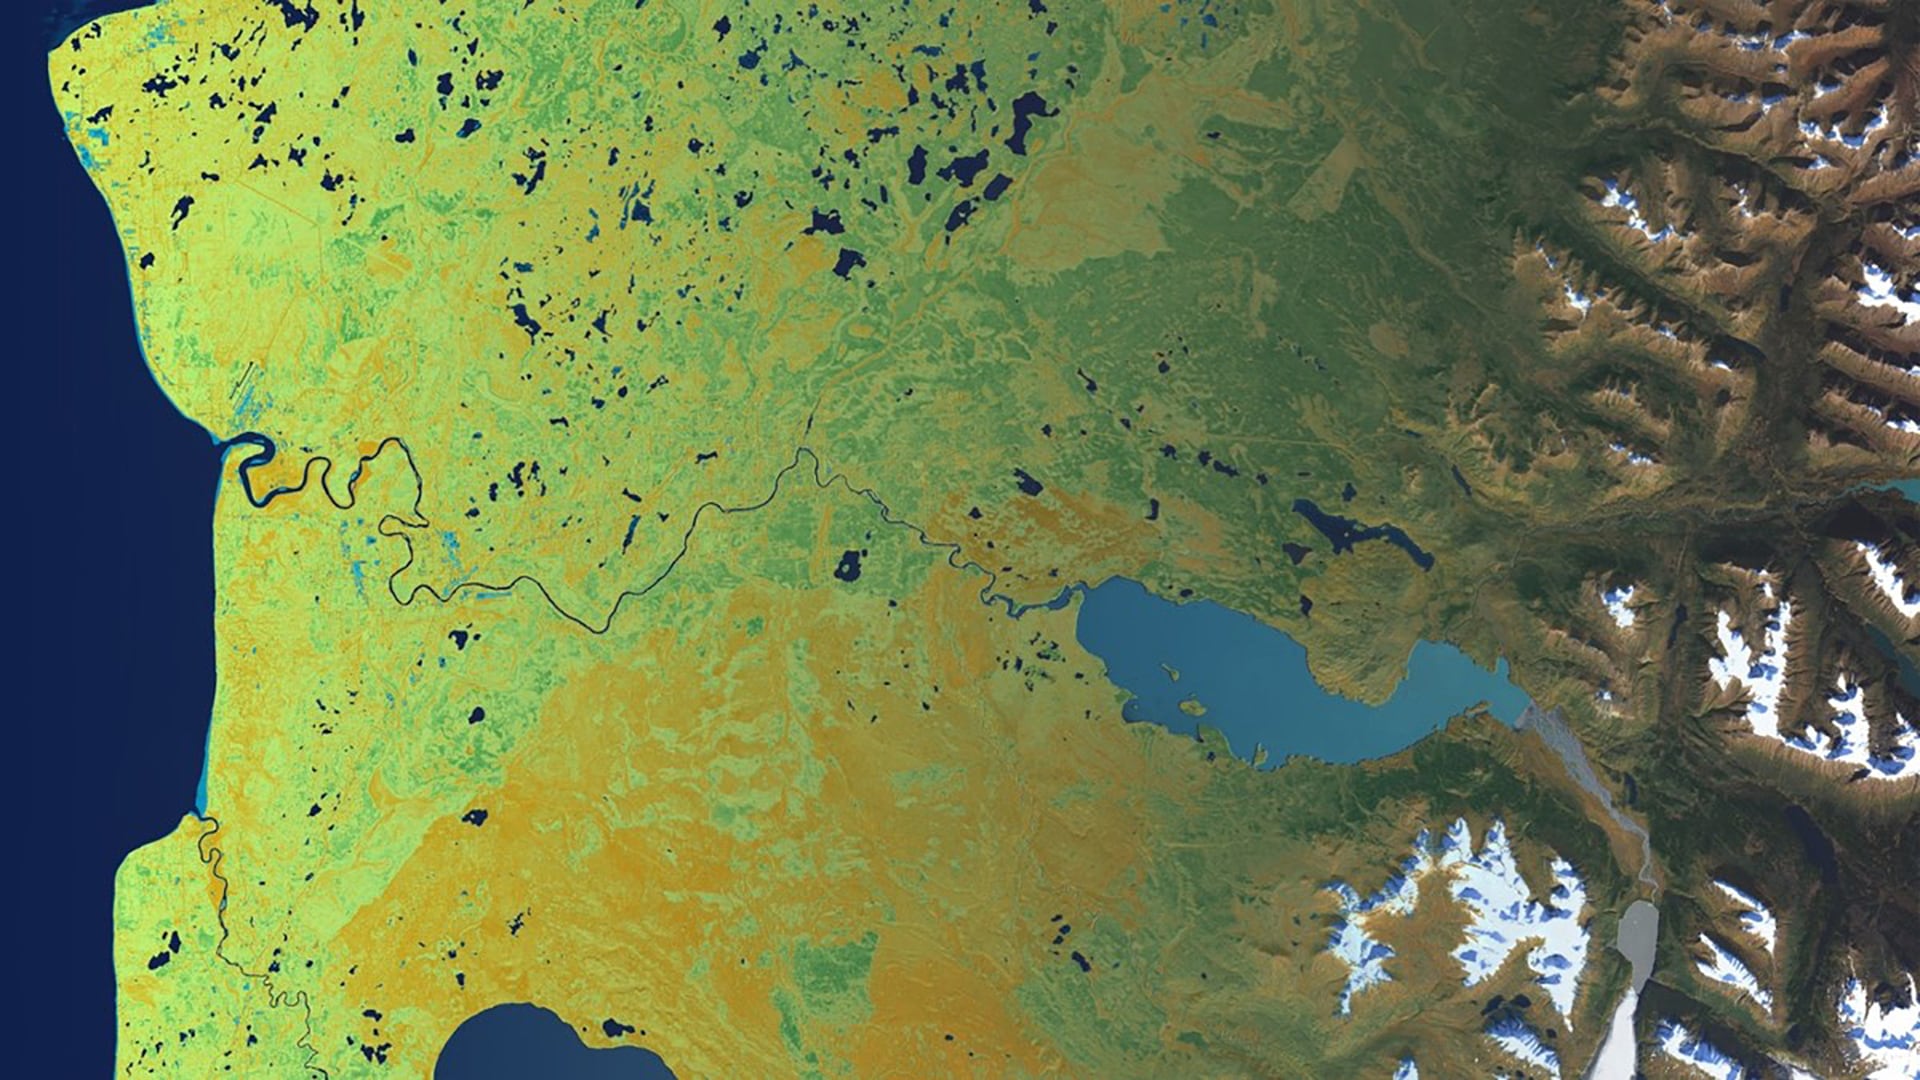
Rising temperatures alter growing conditions for vegetation that result in changes to habitat distribution and abundance. In Alaska, these ecological changes present challenges to land managers planning to accommodate species of interest such as Dall's sheep and ptarmigan. NASA DEVELOP partnered with the Kenai National...

Principal Investigator

Byron Schuldt

Imagen
Tasseled-cap processed Landsat 8 OLI image from August 26th, 2019. “Greenness” is displayed on a color ramp where red represents low greenness and blue represents high greenness. Costilla Creek, which feeds into Costilla reservoir at the bottom of the image, stands out in blue in the. These blue areas are likely wetland locations, as wetlands typically retain green vegetation into late summer.  Keywords: Wetlands Mapping, Cutthroat Trout, Abby Eurich, Byron Schuldt, Kathryn Tafoya, Toryn Walton

Over the last century, the Rio Grande cutthroat trout (Oncorhynchus clarki virginalisi; RGCT) population has declined significantly due to habitat loss, competition, and hybridization with non-native trout species; the species currently occupies roughly 11% of its historic habitat...

Principal Investigator

Amanda Wasserman

Imagen
Measuring California Air Quality through the Use of Earth Observations to Assess the Socioeconomic Distribution of Air Pollution and Effects of Policy Initiatives

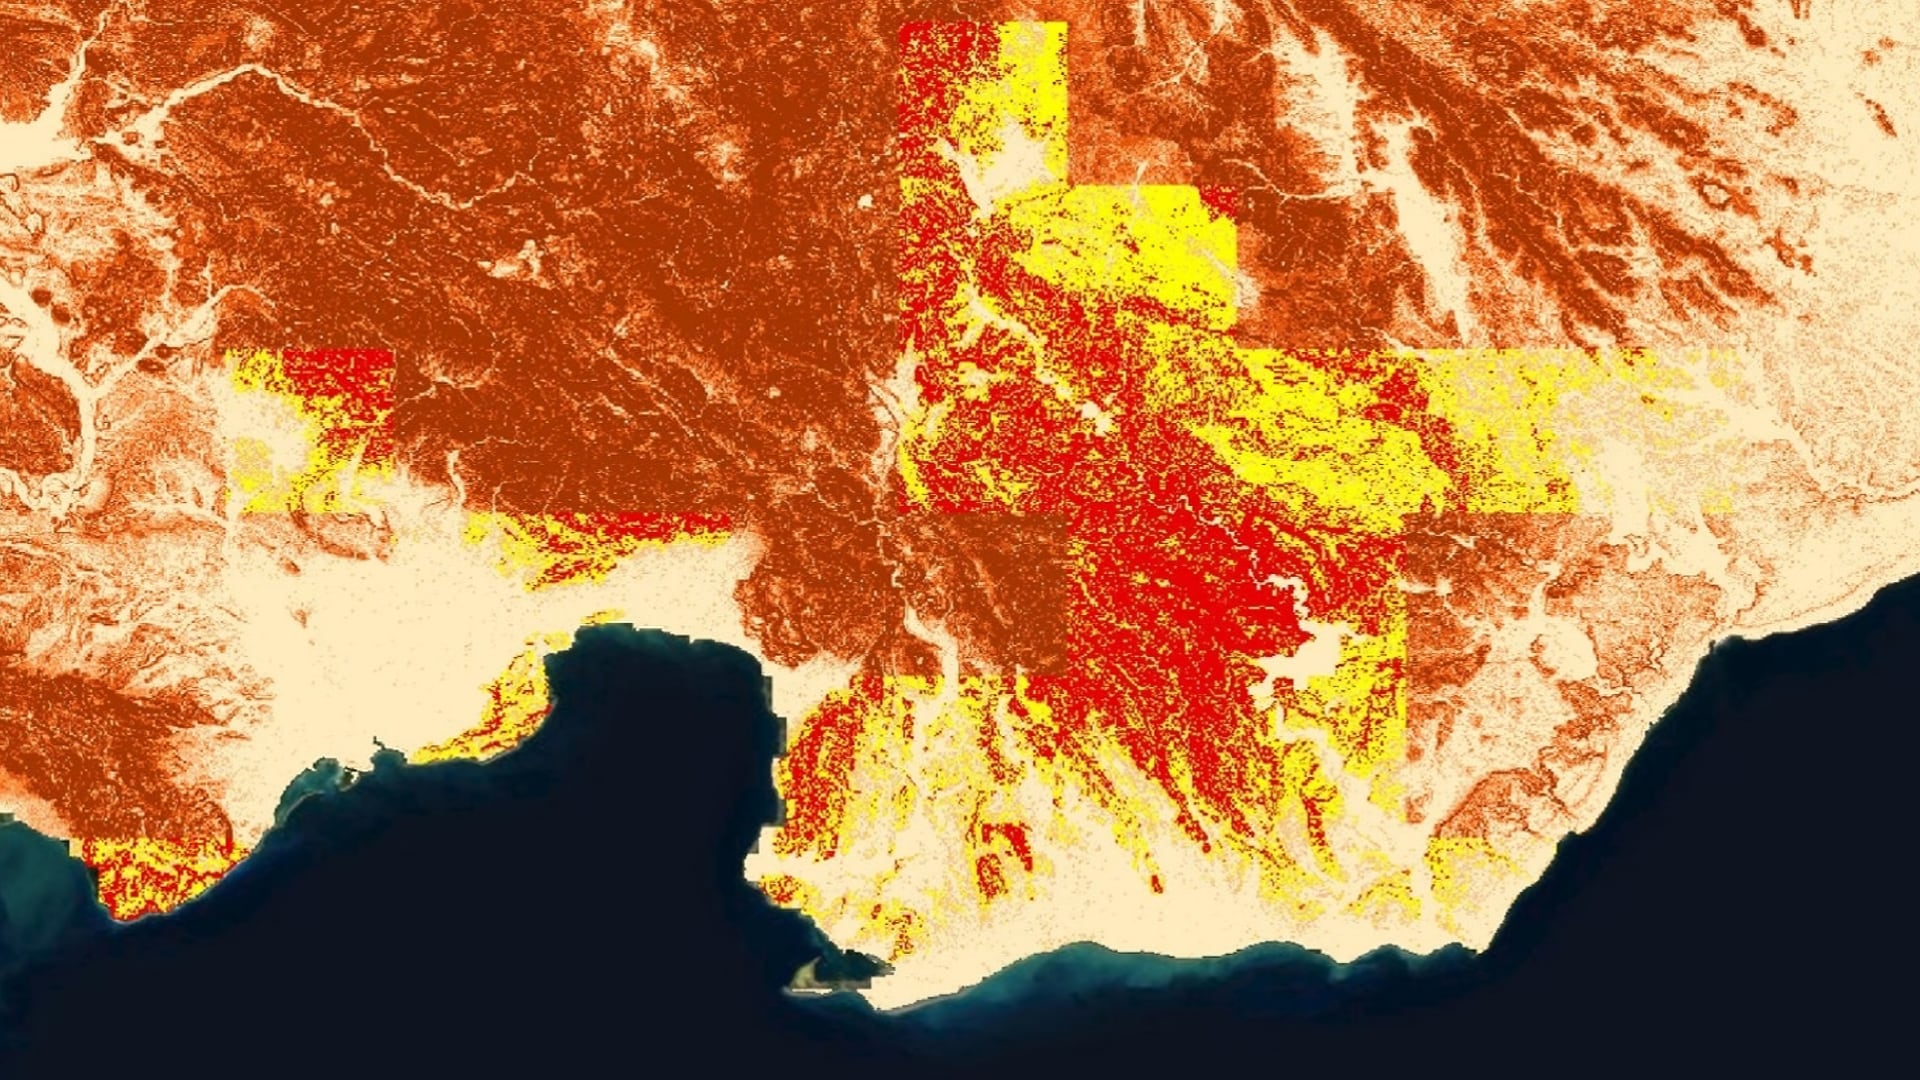
Thirty-five million California residents live in counties where they are more susceptible to contracting an air quality-related health ailment. Particulate matter less than 2.5 µm in size (PM2.5) is an important metric of air quality and can cause significant health problems. Despite California's policies targeted...

Principal Investigator

Palchen Wangchuk

Imagen
NDVI was processed from fall of 2019 using Landsat 8 Top Of Atmosphere imagery. Annual average land surface temperature (LST) was retrieved from MODIS for 2019. The area around Gelephu in the Southern part of Bhutan is displayed. Light blue represents low LST, red represents high LST, and medium range of LST is indicated by light purple. Healthier vegetation is indicated by green. Examining these variables can help partners in planning suitable elephant ecological corridors.   Keywords: Bhutan, Gelephu, Landsat 8 TOA, MODIS, NDVI, LST​

Asian elephants (Elephas maximus) are a flagship species essential for the functioning of forest ecosystems, and they also have cultural significance in Bhutan. Elephants receive the highest legal protection as listed under Schedule I of the Bhutan Forests...

Principal Investigator

Anna Winter

Environmental contaminants are becoming increasingly prevalent in riverine ecosystems. The status of contaminants in western Montana’s relatively pristine river systems is largely unknown. Monitoring for heavy metals, brominated flame-retardants (BFRs), and pharmaceuticals is important due to their negative effects on ecosystems. Exposure to these contaminants can have significant endocrine, neurological, and reproductive effects. Contaminants easily travel up...