NASA

NASA
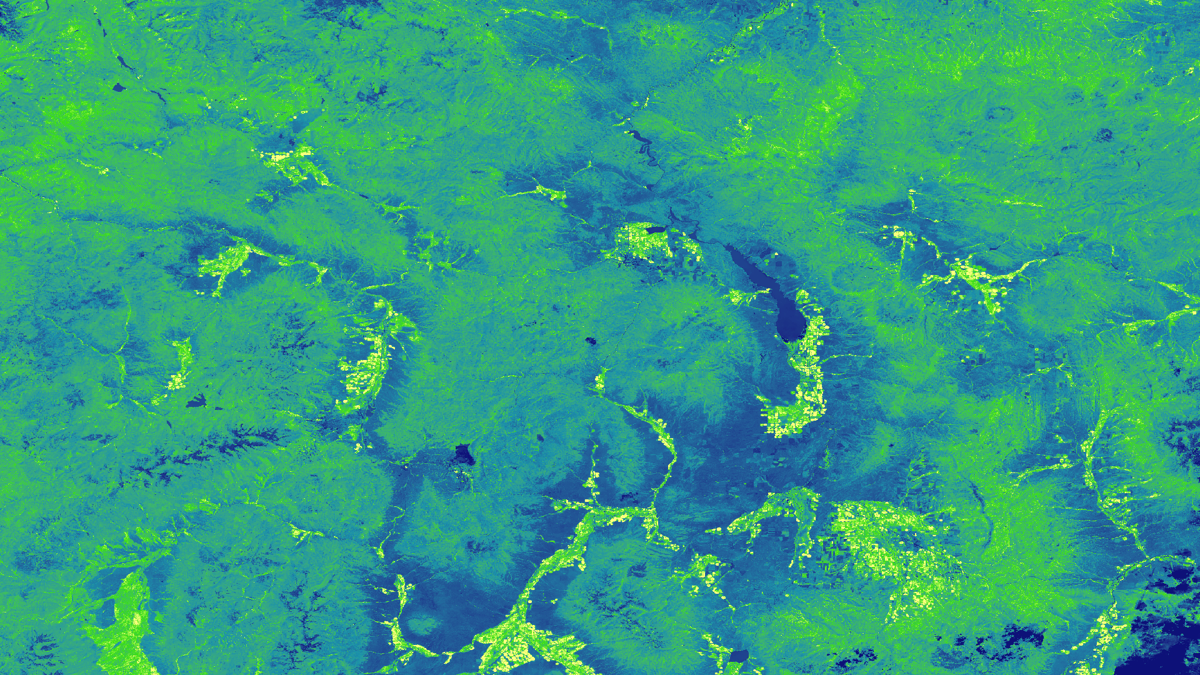
Tasseled cap greenness transformation derived from Landsat 8 imagery over lodgepole pine forest in the Intermountain West study area
Completed Projects
Caley Feemster
Artisanal and small-scale gold mining (ASGM) is responsible for a large fraction of deforestation and disturbance in Amazonia. These activities cause severe impacts on the rainforest ecosystem and socioeconomic state of the region. NASA DEVELOP partnered with the Asociación para...
Pamela Kanu
Submerged Aquatic Vegetation (SAV) is an important component of coastal ecosystems, and is vulnerable to increased turbidity in the water column. It provides stability and protection to sediment deposits, and offers food and shelter to economically valuable species of marine life. Recent urban development and...
Lisa Dong
Aquatic ecosystems are susceptible to biodiversity loss due to increased water temperatures, which can select for heat-tolerant species and lead to a loss of locally adapted species that have a narrow temperature range. Regulations concerning heated effluent from nuclear power...
Suravi Shrestha
The Osa Peninsula, located in the southern region of Costa Rica's Pacific Coast, is one of the most biologically-diverse places on Earth and is a popular ecotourism destination. However, the area faces watershed degradation and loss of biodiversity due to deforestation, pollution from agriculture, and...
Jonathan O'Brien
Extreme heat during the summer months is a major public health issue in many cities worldwide. Local governments are increasing efforts to mitigate heat in cities through the implementation of infrastructure adaptations, including expansion of the urban tree canopy and white roofing, as well as...
Paxton LaJoie
The Urban Heat Island (UHI) effect is a phenomenon characterized by urban areas experiencing temperatures that are, on average, warmer than surrounding suburban and rural regions. UHIs are fueled by expansive impervious surfaces, vehicle emissions, and insufficient urban green space...
Stephanie Kealy
Hampton Roads’ 1.6 million residents thrive on bustling military, harbor, and environmental industries. The region’s stakeholders identified an increasing flood and water quality risk due to urbanization, a changing climate, and sea-level rise. These hazards threaten not only the livelihood...
Jacob Ramthun
Desert bighorn sheep (Ovis canadensis; BHS) habitat selection is influenced by the relationship between precipitation patterns and habitat vegetation availability. The ability to effectively measure habitat resource quality and availability, and understand mortality rates caused by disease and predation is needed to enhance BHS habitat...
Adelaide Schmidt
The dry corridor resides primarily in the pacific region of Central America, which experiences severe drought during the El Niño Southern Oscillation cycle. El Niño causes severe climate variances in Central America that impact agriculture, livelihoods, and hydrological cycles. The...
Danielle Quick
Submerged Aquatic Vegetation (SAV) is vitally important to the Chesapeake Bay, serving as one of the primary food sources for the organisms that inhabit the Bay. This project evaluated the efficacy of remote sensing applications as a tool to monitor water quality parameters, specifically...