Displaying 411 - 420 of 473
![Canopy cover in the greater Ben Delatour Scout Ranch region from a 2013 NAIP Image with a slope and aspect layer derived from a 10-meter digital elevation model (DEM). This image illustrates how elevation-derived variables are used to inform classification models to map canopy cover. Canopy is displayed as red, and the map illustrates that there are higher concentrations of canopy on northern aspects- illustrating the nature of tree density in our study region. ](/sites/default/files/styles/lis/public/2023-05/2023Spring_CO_FrontRangeWildlandFires_WebsiteImage.png.webp?itok=MHr1Zy9O)
Topic
Front Range Wildland Fires (2023 Spring) Team: Nora Carmody (Project Lead), Lillian Gordon, Nathan Teich, Josh Virene Summary: Over the last several decades, wildfire frequency...
![Snow persistence data were processed into snow zones from Terra MODIS 500m resolution data from 2001-2020. 2021 30m resolution rangeland biomass data from the RPMS website. RPMS data (brown and black) are derived from Landsat 5 TM, 7 ETM+, 8 OLI, and 9 OLI-2. The image displays snow persistence zones, with intermittent, transitional, and persistent snow zones in orange, light blue, and dark blue respectively. The image includes parts of the Sawatch and Elk Mountains.](/sites/default/files/styles/lis/public/2023-05/2023Spring_CO_WesternSlopeAg_Website_image.jpg.webp?itok=A7yts3_b)
Topic
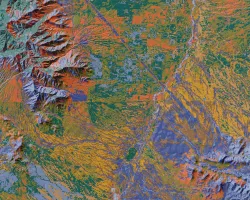
Southern Rockies Western Slope Agriculture (2023 Spring) Team: Adelaide Gonzalez (Project Lead), Rachel Buchler, Max VanArnam, Stephanie Willsey Summary: Over the last decade, the southern...
![Land cover classification of the Arizona – Mexico border region from April 26, 2022 Landsat 8 OLI imagery. Colors represent land cover types determined by a machine learning clustering algorithm. Classifications help natural resource specialists assess vegetation cover and invasive spread, informing land management practices. The landscape impact of the border is visible as the horizontal break roughly mid-image––Coronado National Memorial and other conserved lands abut the border and experience landscape i](/sites/default/files/styles/lis/public/2023-05/2023Spring_GA_CoronadoEco_WebsiteImage.jpg.webp?itok=-sRGC428)
Coronado Ecological Conservation (2023 Spring) Team: Carson Schuetze (Project Lead), Tyler Guigneaux, Charles Robinette, Josie Bourne Summary: Species monitoring is essential for mitigating the impacts...
![The image was collected by Landsat 9 on January 26 of 2023 showing Skidaway Island and waterways on the Georgia coast. The data shows areas of healthy vegetation and urban areas using a Normalized Difference Vegetation Index (NDVI). The darker orange represents grass and urban areas. Yellow and purple represents forested and densely vegetated areas. The black represents open water.](/sites/default/files/styles/lis/public/2023-05/2023Spring_GA_GeorgiaDisastersII_WebsiteImage.jpg.webp?itok=zhMhpiSz)
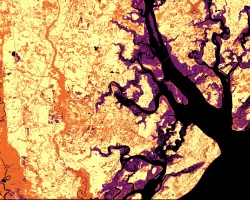
Georgia Disasters II (2023 Spring) Team: Shakirah Rogers (Project Lead), Nathan Tesfayi, Matthew Murray, Clarence Jackson Summary: Heirs property owners are especially vulnerable to natural...
![Soil organic carbon (SOC) is measured here for a depth of 0-5cm from Soil Moisture Active Passive from January 1, 2021 over Peru and Bolivia. SOC is visualized against combined MODIS landcover data for the year 2000 from Aqua and Terra. Shades of lighter pink indicate lower SOC content and darker shades of pink and purple indicate higher SOC content. Conservation International is interested in mapping areas of high SOC content for their conservation efforts.](/sites/default/files/styles/lis/public/2023-05/2023Spring_GSFC_Peru%26BoliviaClimate_WebsiteImage.jpg.webp?itok=RJ-8Cuuo)
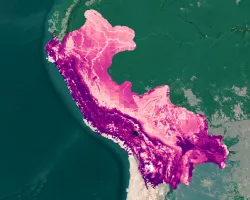
Peru & Bolivia Climate (2023 Spring) Team: Aarti Arora (Project Lead), Aaron Carr, Arina Fuqua, Haydee Portillo Summary: Irrecoverable carbon (IC) reserves contain large stores...
![Median land surface temperature (LST) image over Los Angeles from June to August 2022, as derived from Landsat 8 TIRS data. Higher temperatures are shown in red, while cooler temperatures are displayed in blue. LST data can help investigate the impacts of urban cooling initiatives and inform urban planning decisions to mitigate the impacts of heat within the city.](/sites/default/files/styles/lis/public/2023-05/2023Spring_JPL_LosAngelesUrban_WebsiteImage.png.webp?itok=1olFjNJd)
Topic
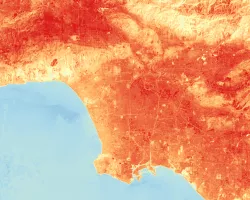
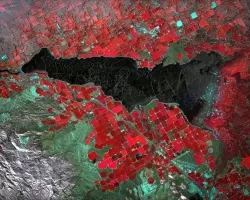
Los Angeles Urban Development (2023 Spring) Team: Leyla Namazie (Project Lead), Julie Gevorgian, Theodore Ross, Stephanie Hernandez Summary: Over the last several decades the city...
![Aerosol Optical Depth for a dust event on July 26th-27th, 2021, calculated with the MAIAC algorithm from Terra and Aqua MODIS satellite data. Great Salt Lake surface area, in blue, was derived from JRC Yearly Water Classification History and processed imagery from Landsat 5, 7, and 8. The map depicts regions that are most impacted by dust surrounding the Great Salt Lake. Red and Yellow represent high dust levels within Northern Utah.](/sites/default/files/styles/lis/public/2023-05/2023Spring_VEJ_GreatSaltLakeHAQ_WebImage.jpg.webp?itok=T6r5Pogy)
Topic
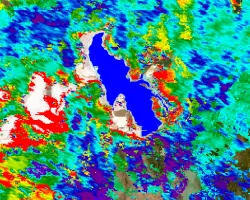
Great Salt Lake Health and Air Quality (2023 Spring) Team: Piper Christian (Project Lead), Fiona Summers, Yoana Vargas Magana, Andrea Delgado Summary: Water flow into...
![Urban heat island effect in New York City, New York calculated using Landsat 8 TIRS imagery from May 2020-21. Red and orange areas depict where the effect is most severe and bus routes are overlayed in white. Areas where bus routes intersect with high heat exposure can be prioritized for bus shelters and community engagement.](/sites/default/files/styles/lis/public/2023-05/2023Spring_VEJ_NewYorkCityTI_WebsiteImage.jpg.webp?itok=UnKpDwG2)
Topic
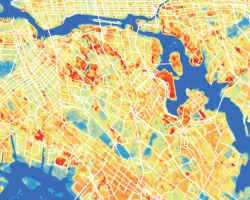
New York City Transportation and Infrastructure (2023 Spring) Team: Thomas Schindelman (Project Lead), Emily Culling, Gianna Méndez Germán, Janna Chapman Summary: New York City, the...
![This image shows the mixed environments near the American Falls Reservoir throughout the year, blended using 2022 summer and winter NDVI false-color composites derived from Landsat 8 OLI and overlaid by a hillshade from SRTM. The white color indicates snowpack in the mountain wilderness, the primary water resource for agriculture and habitats near the reservoir. Bright red denotes marshes and irrigated farms, essential resources for wildlife animals and humans living in Southern Idaho.](/sites/default/files/styles/lis/public/2023-05/2023Spring_ID_IDEco_WebsiteImage.jpg.webp?itok=omiCUyxc)
Idaho Ecological Conservation (2023 Spring) Team: Preethi Malur Balaji (Project Lead), Talissa Cota, Kangsan Lee, Melissa McNally Summary: Management Area in Bingham County, Idaho, has...
![The satellite imagery is a Sentinel-1 Ground Range Detection C-SAR image from July 2nd, 2021, taken over the Sudd Wetland located in South Sudan. The image shows the 'VV' backscatter values, which correlate to vertical transmission and vertical reception from the C-SAR instrument and are used to classify wetland inundation extent. Low 'VV' values (blue) represent areas covered by open waters & inundated land areas and high 'VV' values (yellow) represent dry land areas.](/sites/default/files/styles/lis/public/2023-05/2023Spring_JPL_WETWater_WebsiteImage.jpg.webp?itok=UViLBf_D)
Topic
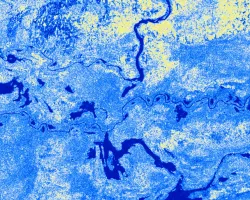
WET Water Resources (2023 Spring) Team: Lori Berberian (Project Lead), Kaely Harris, Mitch Porter, Emma Waugh Summary: Wetland ecosystems are annually or seasonally wet transition...