Displaying 541 - 550 of 568
![Runoff retention values in Richmond, VA estimated by the InVEST Urban Flood Risk Mitigation Model for a June 2, 2018, extreme rainfall event measured by GPM IMERG. Dark blue areas have high runoff retention capacity and absorbed more of the rainfall during the storm; light green areas absorbed less rainfall during the storm, increasing the likelihood of pluvial flooding. Pluvial flood risk maps help inform community planners’ efforts to protect vulnerable populations.](/sites/default/files/styles/lis/public/2023-11/2023Sum_LaRC_RichmondDisasters_WebsiteImage.jpg.webp?itok=17L81iXz)
Richmond Disasters (Summer 2023) Team: Kaylee Tanner (Project Lead), Brodie Thiele, Trinity Johnson, Maggie Lincoln Summary: Pluvial flooding is the most frequent and widespread type...
![Map showing southeast Los Angeles urban heat exposure around community locations identified by Research Leadership Academy participants.](/sites/default/files/styles/lis/public/2024-01/Douglas_EEJ.jpg.webp?itok=X2Hz9n30)
Topic
In partnership with Communities for a Better Environment, a community-based organization leading the advancement of zero-emission technologies and green infrastructure in environmental justice communities, our...
Topic
This project explores the potential of Remote Sensing (RS) and spatial data to advance Environmental Justice, with a focus on tribal land and water resources...
![Chlorophyll-a imagery from Aqua MODIS for March 2022 in the Gulf of Maine. Simulated PACE OCI data are derived from Aqua MODIS. Areas in red have a high chlorophyll-a concentration, meaning that the water is high in nutrients such as nitrogen and phosphorus, which cause algae to grow. Areas in blue have a low chlorophyll-a concentration, so the conditions are not present for harmful algal blooms.](/sites/default/files/styles/lis/public/2024-01/2023Sum_GSFC_PACEWater_WebsiteImage.jpg.webp?itok=_PCfcx9Q)
Topic
PACE Water Resources (Summer 2023) Team: Jules Kourelakos, Isabel Lubitz, Matt Romm, Grace Thorpe Summary: This project aimed to develop tools to support the future...
![NDVI-processed imagery from Landsat 8 OLI/TIRS data. This composite image of Washington, D.C., and the surrounding area representing max green values over the summer months of 2022. Blue shades in the image represent vegetated areas, while green and yellow shades represent water and areas with no vegetation. Plant cover has a major impact on water quality, making it crucial for the National Park Service to understand the state of vegetation in this region.](/sites/default/files/styles/lis/public/2024-01/2023Sum_GSFC_PotomacRiverBasinWater_WebsiteImage.png.webp?itok=6F3K9dyn)
Topic
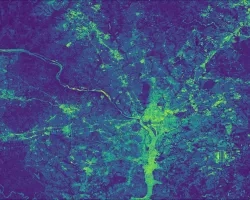
Potomac River Basin Water Resources (Summer 2023) Team: Zach Kinloch, Divina Lade, Xavier García López, Haydee Portillo Summary: The Potomac River Basin (PRB) is responsible...
![NDMI-index imagery from Landsat 8 OLI and SRTM data, taken on August 30, 2022. The image showcases vegetation water content in the northern part of Capitol Reef National Park. Blue regions indicate vegetation with higher moisture content, vital in semi-arid environments. In contrast, red and yellow regions suggest less hydrated vegetation. This image offers valuable insights into moisture dynamics in arid regions like Capitol Reef.](/sites/default/files/styles/lis/public/2024-01/2023Sum_ID_CapitolReefEco_WebsiteImage.jpg.webp?itok=nnyT7FVy)
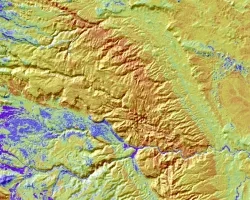
Capitol Reef Ecological Conservation (Summer 2023) Team: Vanchy Li (Project Lead), Evgeny Mazko, Kyleigh Kowalski, Drew Comin Summary: Capitol Reef National Park (CARE) reached out...
![Normalized Difference Vegetation Index (NDVI) of the Savannah River Estuary in Georgia calculated from an October 2022 image taken by NASA's Landsat 8 OLI sensor. Low NDVI values, including water, are represented in blue, while high NDVI values, showing areas of higher vegetation, are in green. Saltwater intrusion into coastal soils is impacting vegetation health in this area, causing tree die-off and the formation of ghost forests.](/sites/default/files/styles/lis/public/2024-01/2023Sum_JPL_SECoastEco_WebImage.jpg.webp?itok=r2tt6Mye)
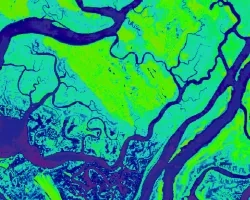
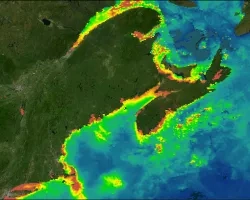
Southeast Coast Ecological Conservation (Summer 2023) Team: Emma Cheriegate (Project Lead), Eleri Griffiths, Quintin Munoz, Vivienne von Welczeck Summary: Shallow aquifers along the southeastern US...
![Lake Anna NDCI calculated using Sentinel-2 MSI images overlaying surface temperature imagery processed from Landsat 8 OLI data from May to September of 2021. Surface temperature is represented by shades of blue and green. Within the body of the lake, chlorophyll concentrations are represented on a gradient scale from purple to yellow, with yellow indicating highest concentrations. Higher temperatures can increase chlorophyll concentrations and are therefore of interest for Harmful Algal Blooms in Lake Anna.](/sites/default/files/styles/lis/public/2024-01/2023Sum_LaRC_LakeAnnaWater_WebsiteImage_v3.jpg.webp?itok=yv0lTk6B)
Topic
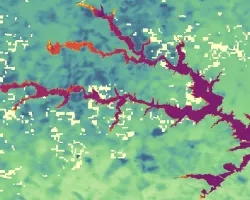
Lake Anna Water Resources (Summer 2023) Team: Olivia Etherton (Project Lead), Caroline Bahun, Alexander Krest, Justin Wilder Summary: Lake Anna is a man-made reservoir and...
![Magnitude of largest model break in Continuous Change Detection Algorithm harmonic regression model, indicative of clearcut logging in the Oregon coast range forests. Imagery from Landsat 4-5 TM, Landsat 7 ETM+, and Landsat 8-9 OLI from across the study period 2000-2021 over standard hill shade. Patches of blue show clear cut areas with lavender then yellow indicating higher magnitude. Green areas represent forests untouched during the study period.](/sites/default/files/styles/lis/public/2024-01/2023Sum_MA_OregonCoastRangeEco_websiteImage.jpg.webp?itok=sGJs5DSB)
Oregon Coast Range Ecological Conservation (Summer 2023) Team: Emily French (Project Lead), Uma Edulbehram, Sarah Hughes, Madison Arndt Summary: Logging operations are widespread across the...
![Daytime average land surface temperature over June 2022 from ECOSTRESS, an instrument on the ISS. Warm colors highlight the City of Huntsville, which is surrounded by central North Alabama. In both color gradients, darker colors represent higher temperatures. The Tennessee River, together with Wheeler Lake (left) and Lake Guntersville (right), appear black. Surface temperature is one factor that can help the local government decide where to focus tree-planting efforts to mitigate urban heat.](/sites/default/files/styles/lis/public/2024-01/2023Sum_MSFC_HuntsvilleUrbanII_WebsiteImage.png.webp?itok=4ZkWXUeU)
Topic
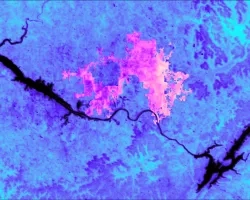
Huntsville Urban Development II (Summer 2023) Team: James Karroum (Project Lead); Awroni Bhaduri, Kindrea Gibbons, Natalie O'Kraski Summary: Huntsville, Alabama has seen a boom in...