Displaying 31 - 40 of 45
![This image of the Chesapeake Bay is derived from NASA Landsat 7 ETM+ and Landsat 8 OLI imagery. It represents median Normalized Difference Turbidity Index (NDTI) turbidity levels from January 2020 through June 2022. Yellow and orange areas indicate higher turbidity levels. This imagery can be used to determine areas of the bay in which turbidity poses a threat to water quality.](/sites/default/files/styles/lis/public/2022-12/2022Sum_PUP_ChesapeakeBayWater_WebsiteImage.png.webp?itok=tBWfMYEk)
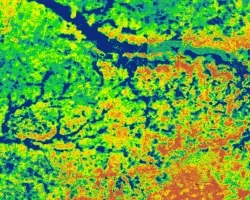
Chesapeake Bay Water Resources (Summer 2022) Team: Katherine Hahn, Julia Atayi, Julia Portmann, Abigail Sgan Summary: An increase in total suspended sediment (TSS) concentrations and...
Affiliation
NASA Goddard Space Flight Center
Program Role
Associate Program Manager, Water Resources
Perry Oddo serves as an Associate Program Manager of NASA's Applied Sciences Water Resources Program.
Affiliation
NASA Marshall Space Flight Center
Program Role
Associate Program Manager, Water Resources and Agriculture
Christopher Hain is an Associate Program Manager in the Water Resources and Agriculture Application Areas.
Capacity Building
Ecological Conservation
Water Resources
![NDTI-processed river imagery from 2021 PlanetScope data with GPM IMERG data shown in blue. The Shoshone River in northwestern Wyoming is shown with red values indicating lower turbidity and yellow values representing higher turbidity. Lighter blue values indicate higher monthly mean IMERG precipitation values for 2021. NDTI values and precipitation averages help watershed managers understand where and when excess sediment enters the river.](/sites/default/files/styles/lis/public/2023-02/2022Fall_PUP_ShoshoneRiverWater_WebsiteImage.jpg.webp?itok=myaPr9UA)
Shoshone River Water Resources (Fall 2022) Team: Robyn Holmes (Project Lead), Will Campbell, Cassie Ferrante, Nelson Lemnyuy Summary: In 2016, a routine repair operation at...
![Land cover imagery processed from Landsat 8 OLI and ocean turbidity data imagery processed from Sentinel-2 MSI. The Tijuana River stormwater plume off the San Diego coast was mapped from data collected on December 5th, 2019, while the land surface data was collected on April 4th, 2022. Shades of red indicate high turbidity values, while blue areas show normal turbidity values. Areas of high turbidity reflect high concentration of pollutants from stormwater runoff.](/sites/default/files/styles/lis/public/2023-02/2022Fall_ARC_SanDiegoWaterResources_WebsiteImage.jpg.webp?itok=Z3fy2AmA)
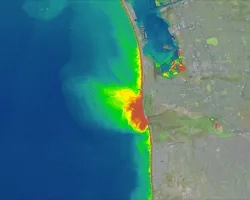
San Diego Water Resources (FALL 2022) Team: Ethan Gates (Project Lead), Stefanie Mendoza, Jonathan Szeto, Max VanArnam Summary: Stormwater and wastewater runoff are a large...
![NDVI-processed imagery taken by Landsat 9 OLI-2 in May 2022 of Bryce Canyon National Park and nearby urban area. Healthy vegetation are visualized as bright yellow, while stressed plants, bare earth, and urban areas approach dark red. The continuity of the Landsat program described vegetation response to pervasive drought conditions in Bryce Canyon which the National Park Service can use to when making conservation decisions.](/sites/default/files/styles/lis/public/2023-02/2022Fall_GSFC_BryceCanyonWaterResources_WebsiteImage.png.webp?itok=mswmR89-)
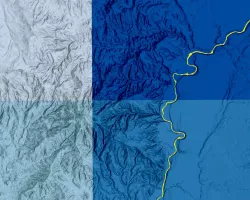
Bryce Canyon Water Resources (Fall 2022) Team: Aaron Carr (Project Lead), Mel Frost, Alissa Stark, Ashley Grinstead Summary: Bryce Canyon National Park is home to...
![We created an averaged seasonal Evaporative Stress Index (ESI) composite for fall 2020 in the west Tennessee region utilizing NASA’s ECOSTRESS sensor onboard the International Space Station. The ESI reveals areas where vegetation is stressed due to lack of water. Dark blue regions represent areas where vegetation is thriving, compared to the yellow areas, where vegetation is experiencing some water stress.](/sites/default/files/styles/lis/public/2023-02/2022Fall_JPL_WesternTNWater_WebsiteImage.jpg.webp?itok=BhQQZWBf)
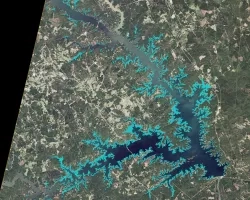
Western Tennessee Water Resources (Fall 2022) Team: Lauren Webster (Project Lead), Elena Pilch, Michael Pazmino, Katera Lee Summary: The Memphis Aquifer (MA) is located in...
![NDTI-processed imagery from Landsat 8 OLI data. This image from October 2021 depicts the turbidity of Keweenaw Bay, western Michigan coastline of Lake Superior. Light blue-colored water indicates greater turbidity while darker blue water is less turbid. Turbid waters indicate coastal erosion and re-distribution of legacy copper mining waste colloquially referred to as "stamp sands". Stamp sands contaminate wetlands and threaten traditional food sources for Indigenous communities along the bay.](/sites/default/files/styles/lis/public/2023-02/2022Fall_LaRC_KeweenawBayWater_WebsiteImage.jpg.webp?itok=J-ICa-DH)
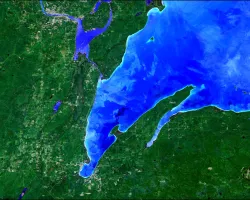
Keweenaw Bay Water Resources (Fall 2022) Team: Khaim Syed-Raza (Project Lead), Sofia Vahutinsky, Lisa Siewart, Nora Whitelaw-McDonald Summary: The Keweenaw Bay Indian Community (KBIC) has...