Image
NASA
NASA
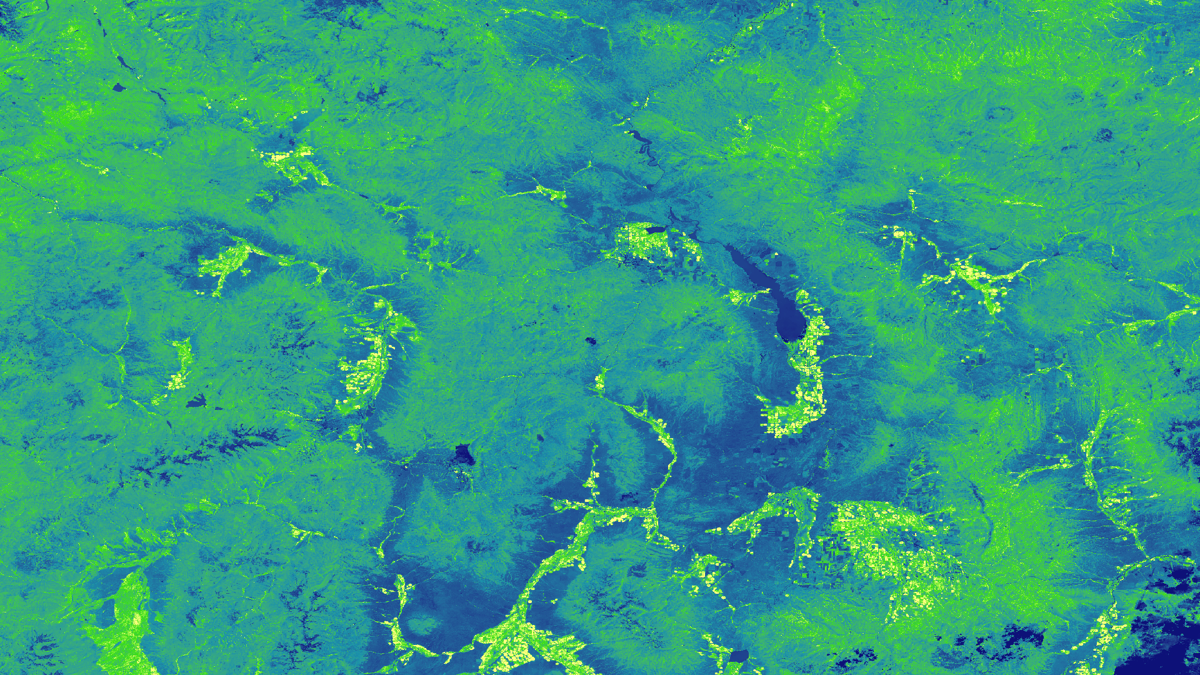
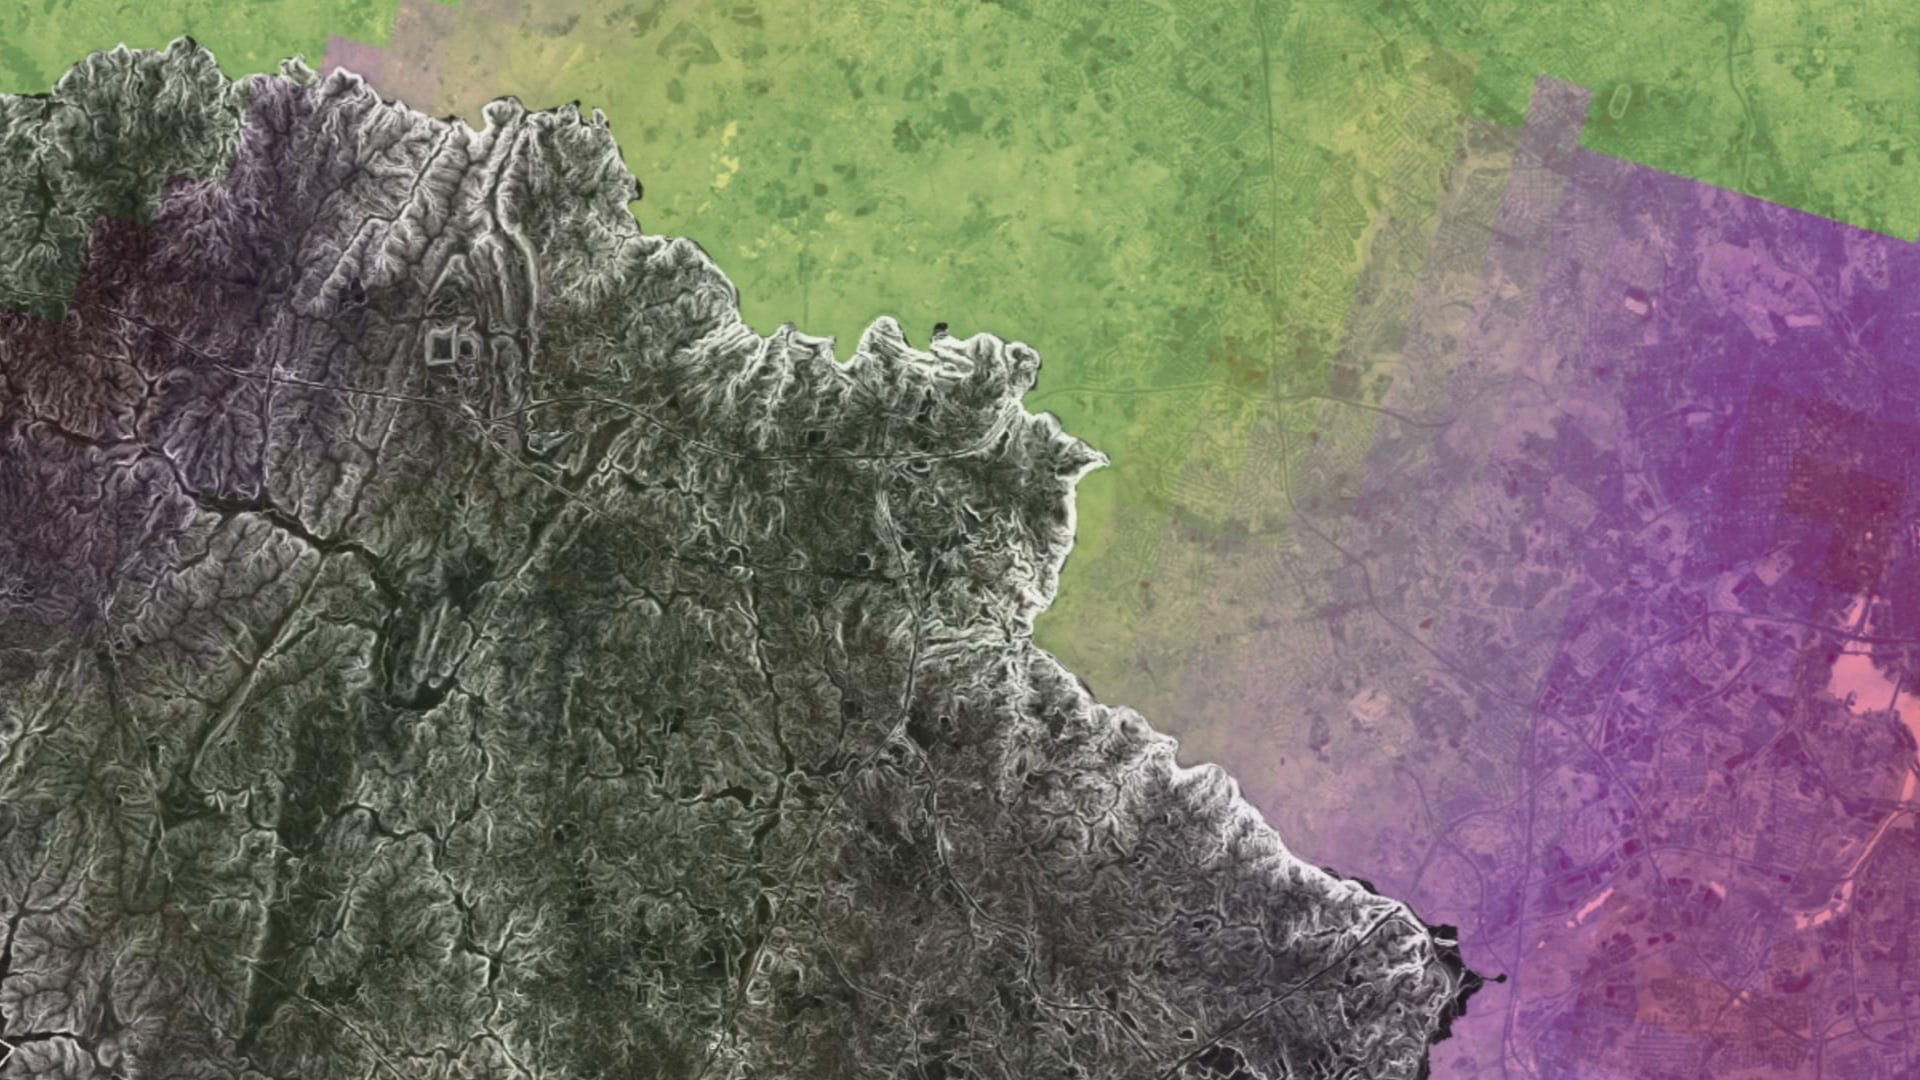
Tasseled cap greenness transformation derived from Landsat 8 imagery over lodgepole pine forest in the Intermountain West study area
Completed Projects
Paxton LaJoie
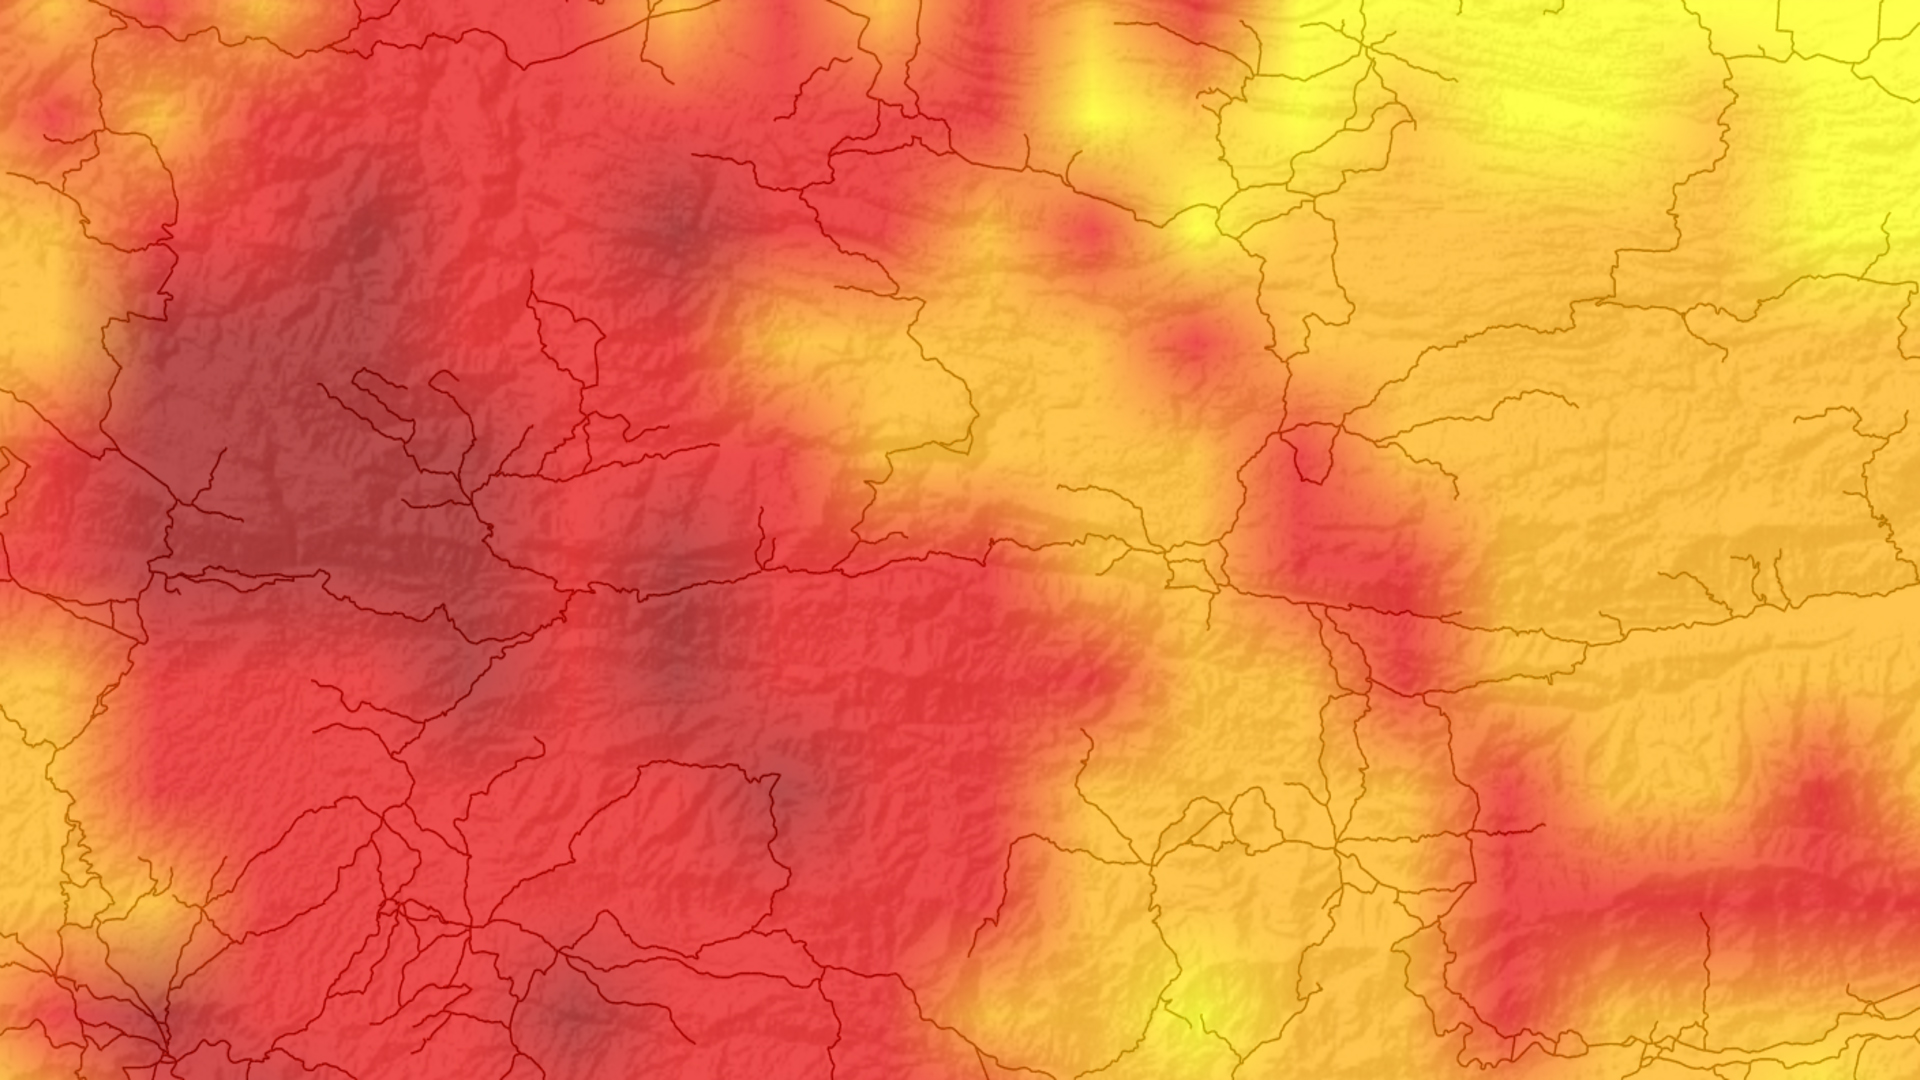
The Urban Heat Island (UHI) effect is a phenomenon characterized by urban areas experiencing temperatures that are, on average, warmer than surrounding suburban and rural regions. UHIs are fueled by expansive impervious surfaces, vehicle emissions, and insufficient urban green space...
Stephanie Kealy
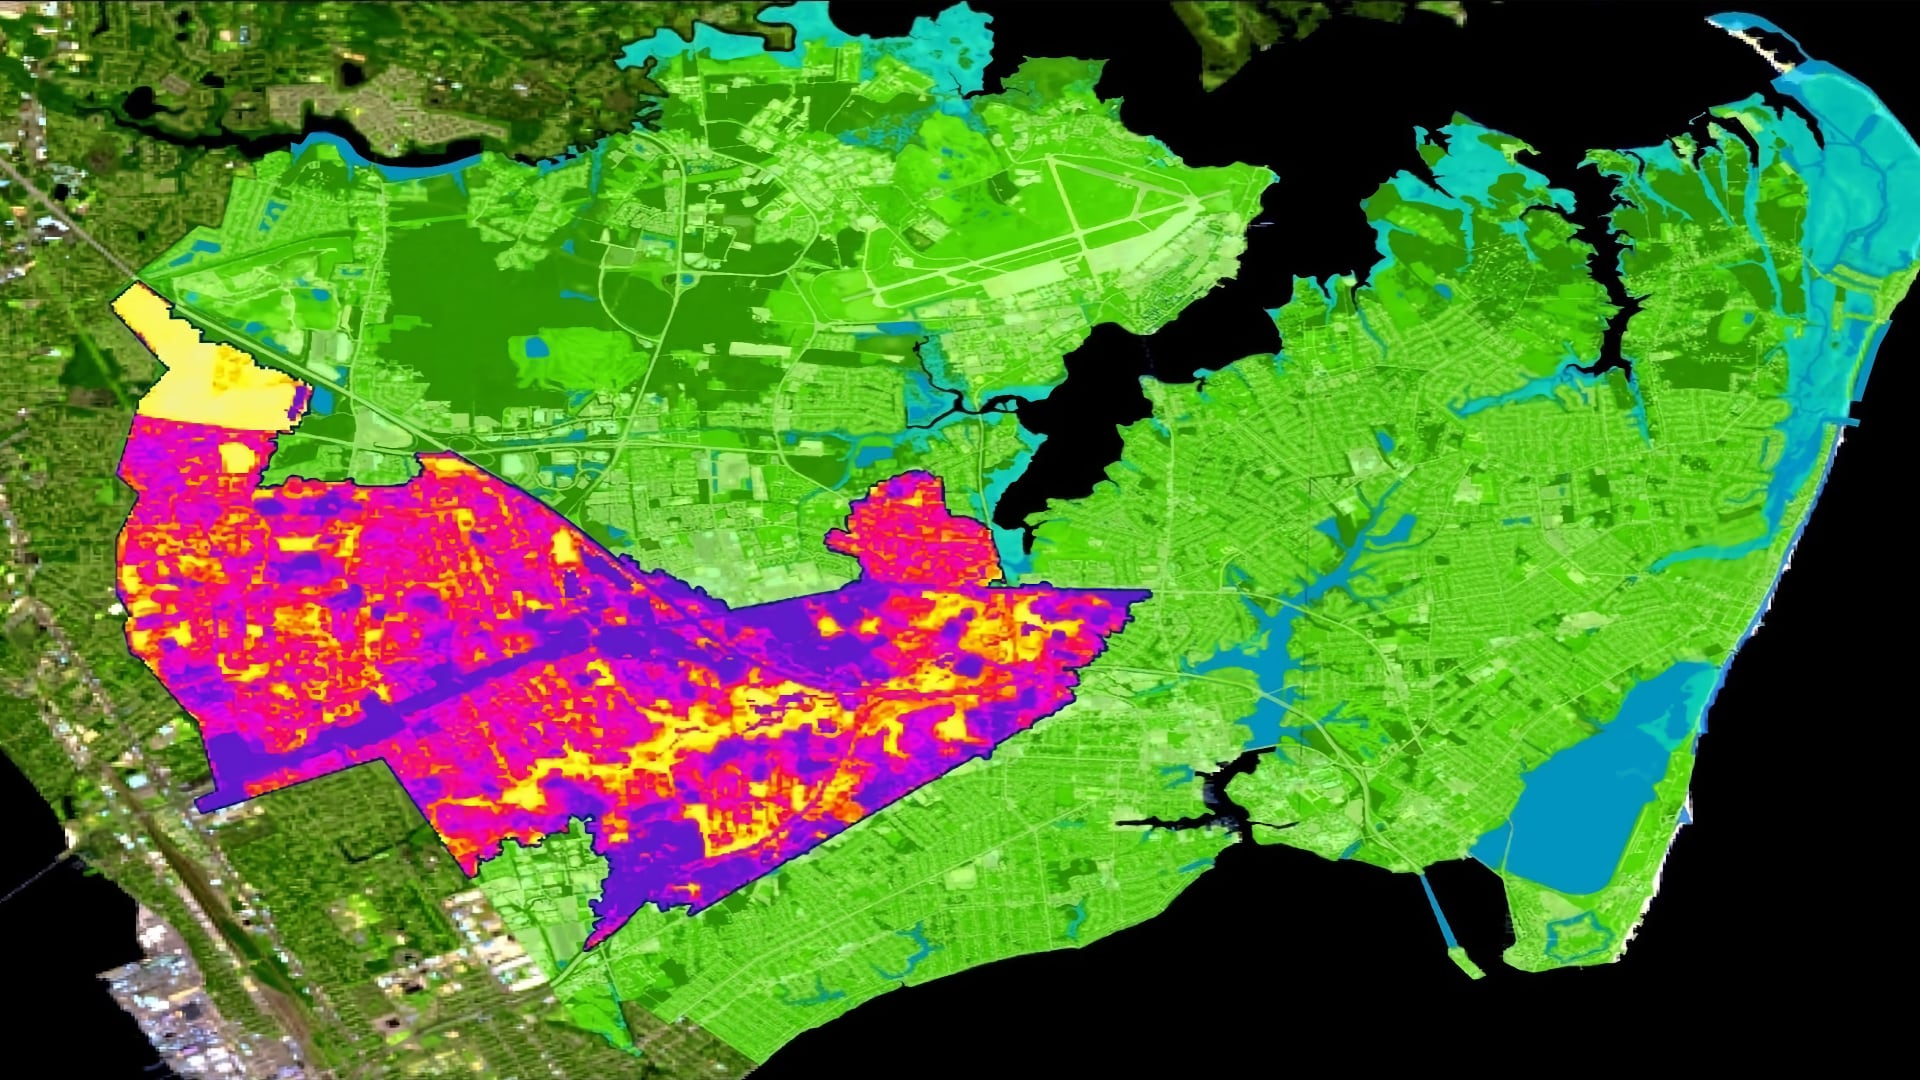
Hampton Roads’ 1.6 million residents thrive on bustling military, harbor, and environmental industries. The region’s stakeholders identified an increasing flood and water quality risk due to urbanization, a changing climate, and sea-level rise. These hazards threaten not only the livelihood...
Jacob Ramthun
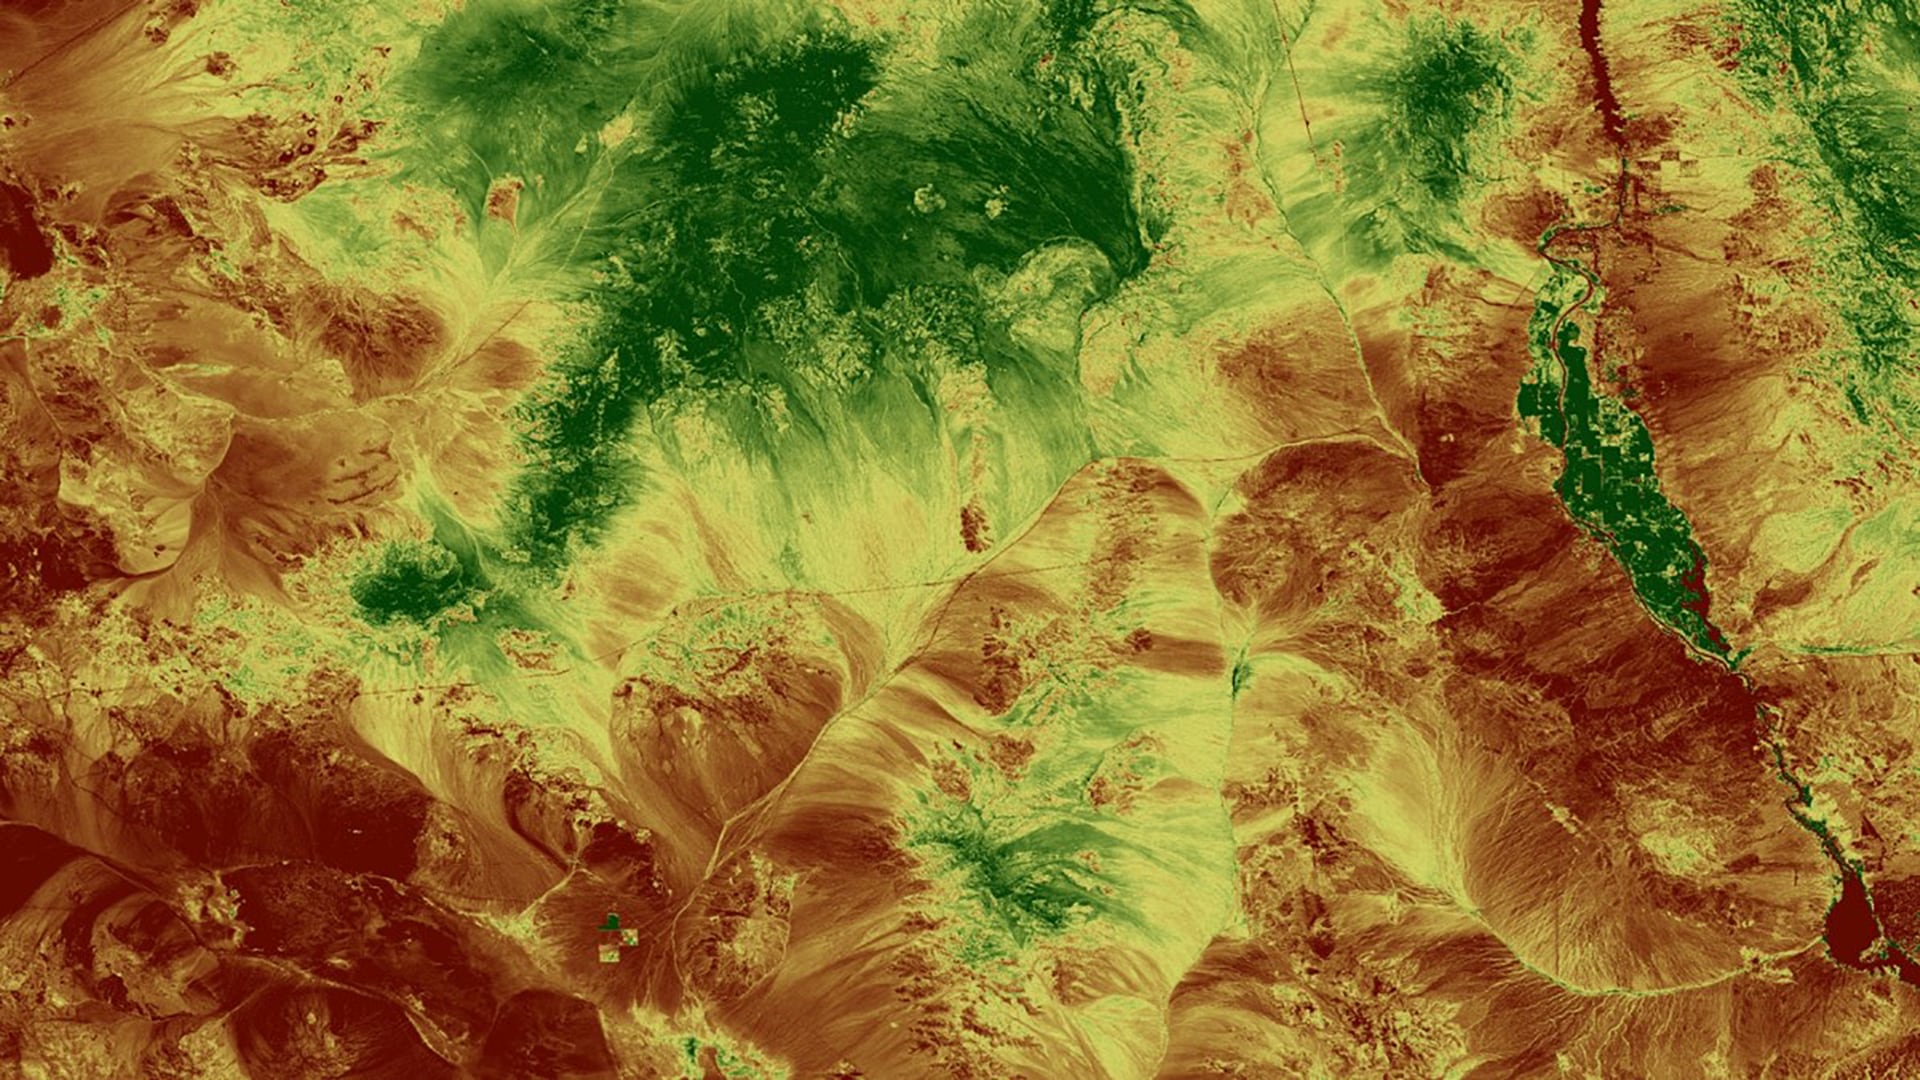
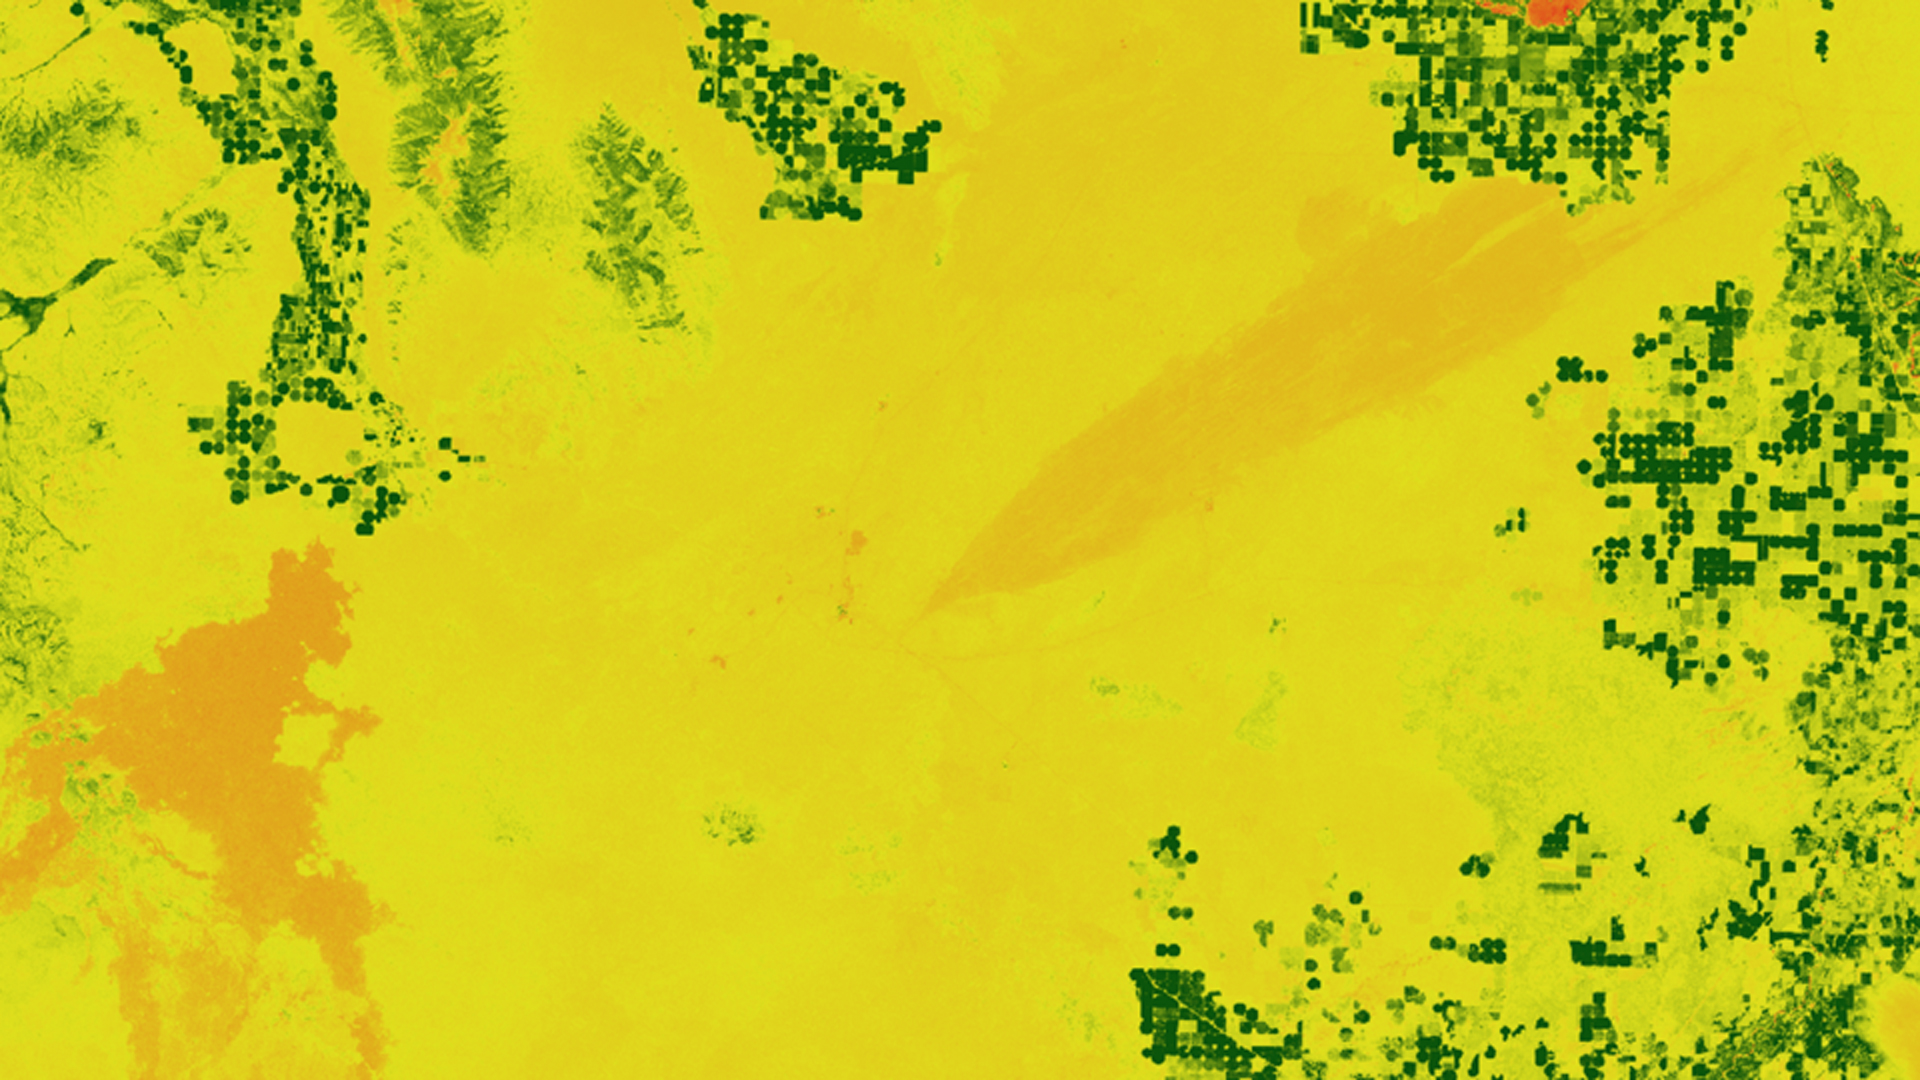
Desert bighorn sheep (Ovis canadensis; BHS) habitat selection is influenced by the relationship between precipitation patterns and habitat vegetation availability. The ability to effectively measure habitat resource quality and availability, and understand mortality rates caused by disease and predation is needed to enhance BHS habitat...
Adelaide Schmidt
The dry corridor resides primarily in the pacific region of Central America, which experiences severe drought during the El Niño Southern Oscillation cycle. El Niño causes severe climate variances in Central America that impact agriculture, livelihoods, and hydrological cycles. The...
Danielle Quick
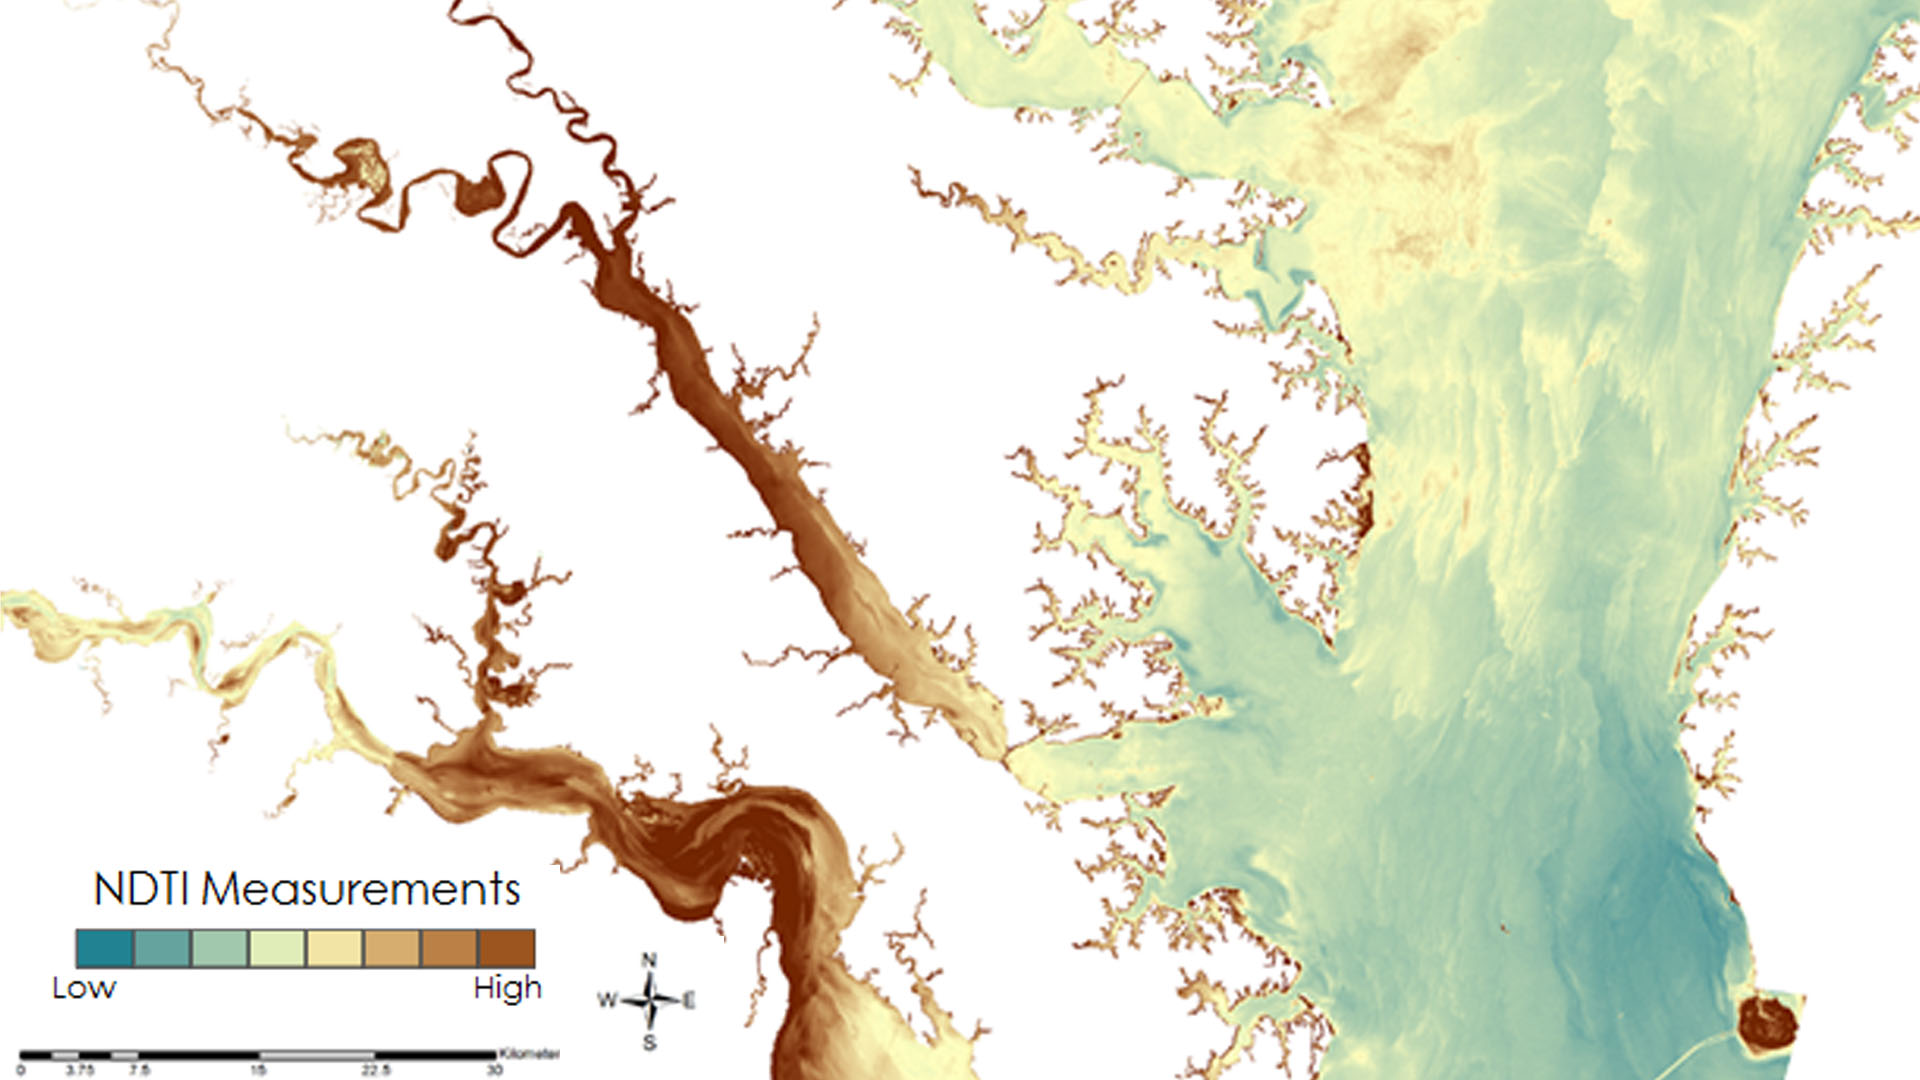
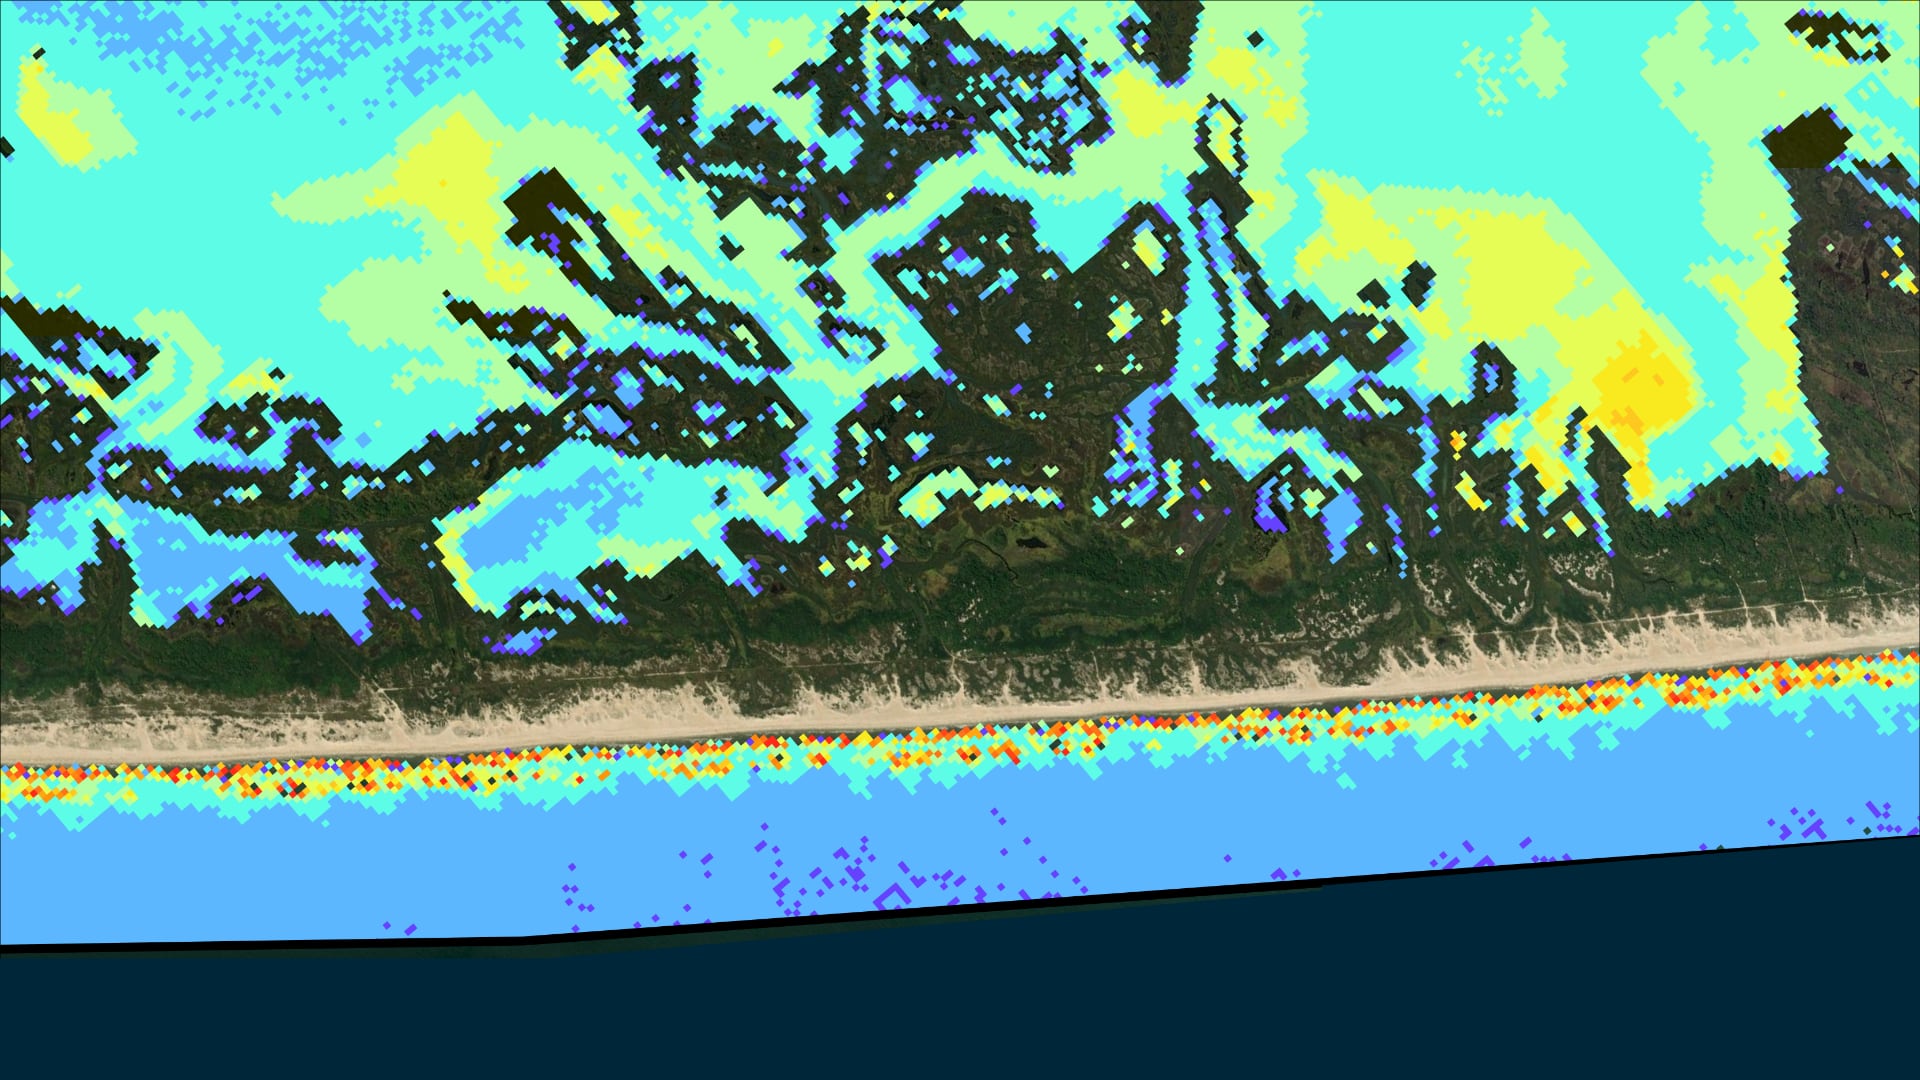
Submerged Aquatic Vegetation (SAV) is vitally important to the Chesapeake Bay, serving as one of the primary food sources for the organisms that inhabit the Bay. This project evaluated the efficacy of remote sensing applications as a tool to monitor water quality parameters, specifically...
Kathrene Garcia
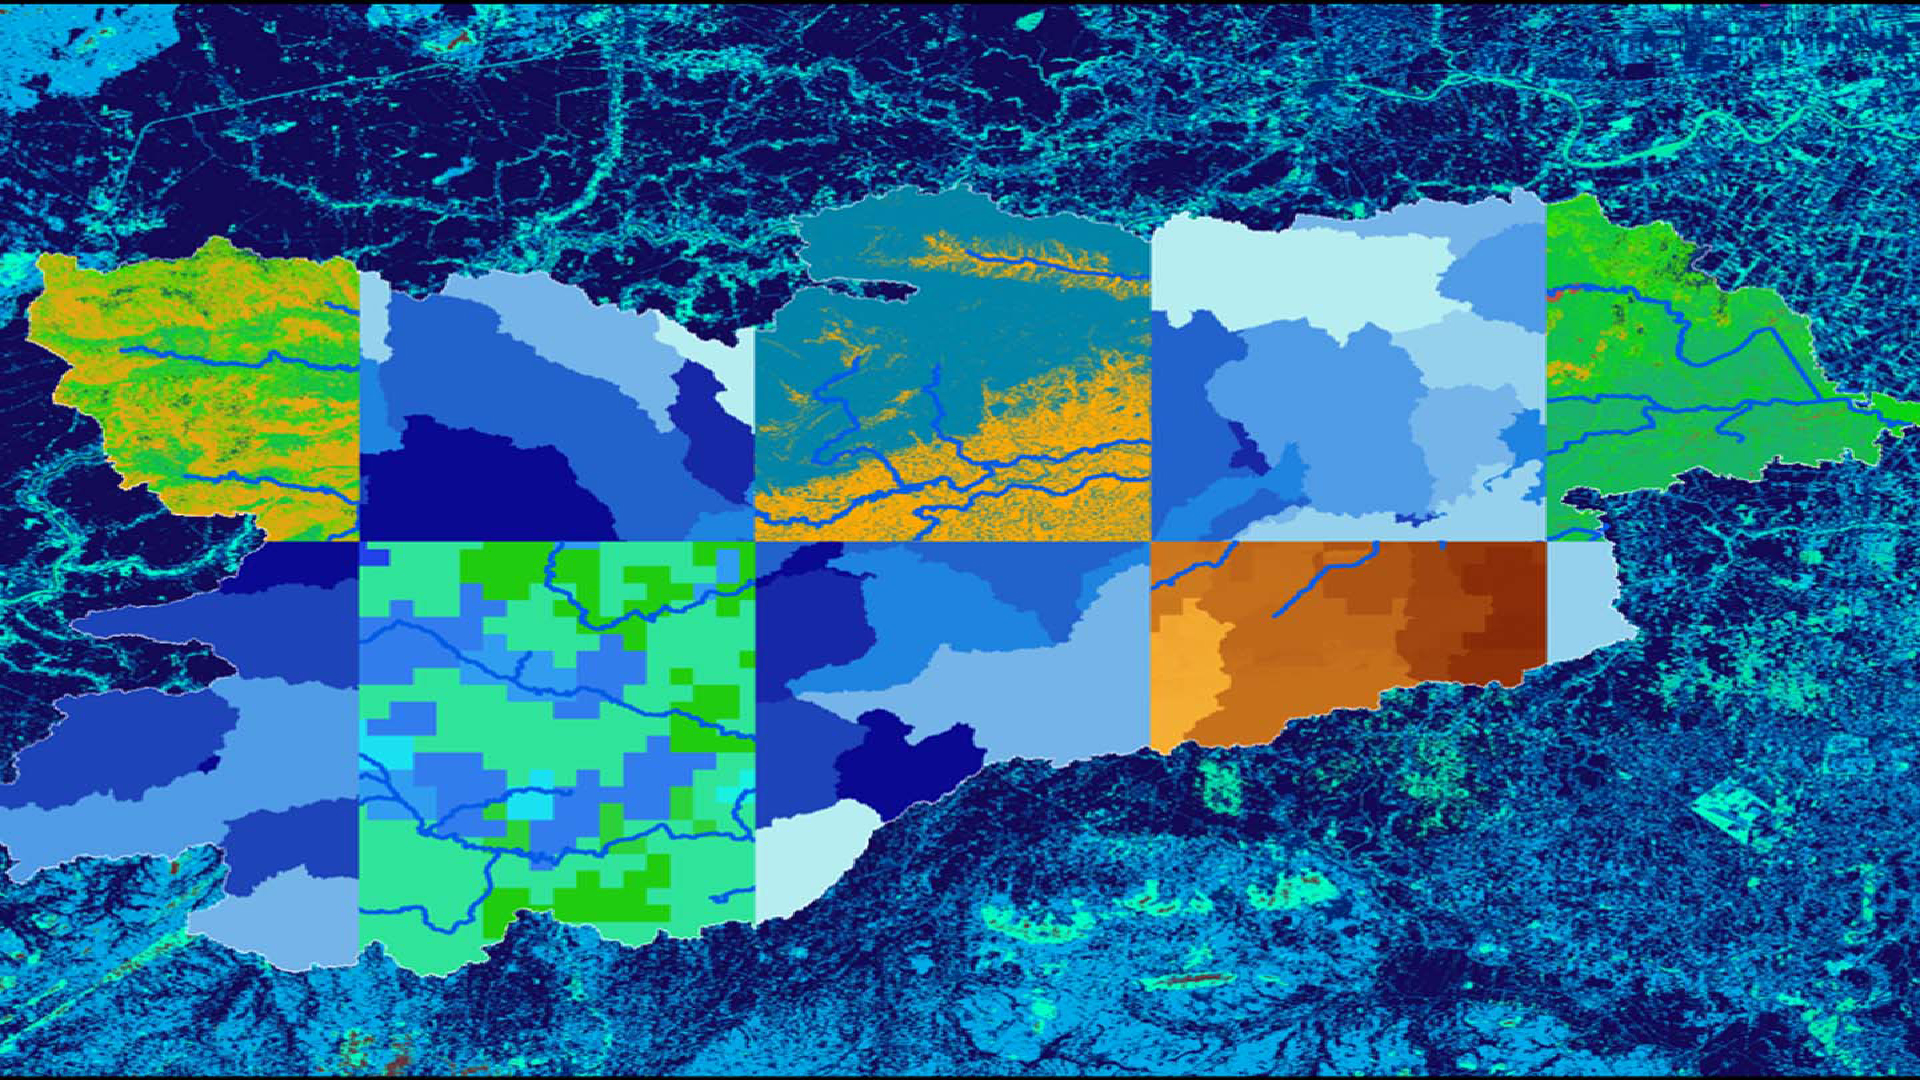
The Chao Phraya River and surrounding watershed has seen an extensive increase in urban development in the last century, while simultaneously experiencing significant degradation in water quality. Covering 30% of Thailand, the Chao Phraya watershed encompasses rural areas and major metropolitan centers, including Bangkok. The...
Annemarie Peacock
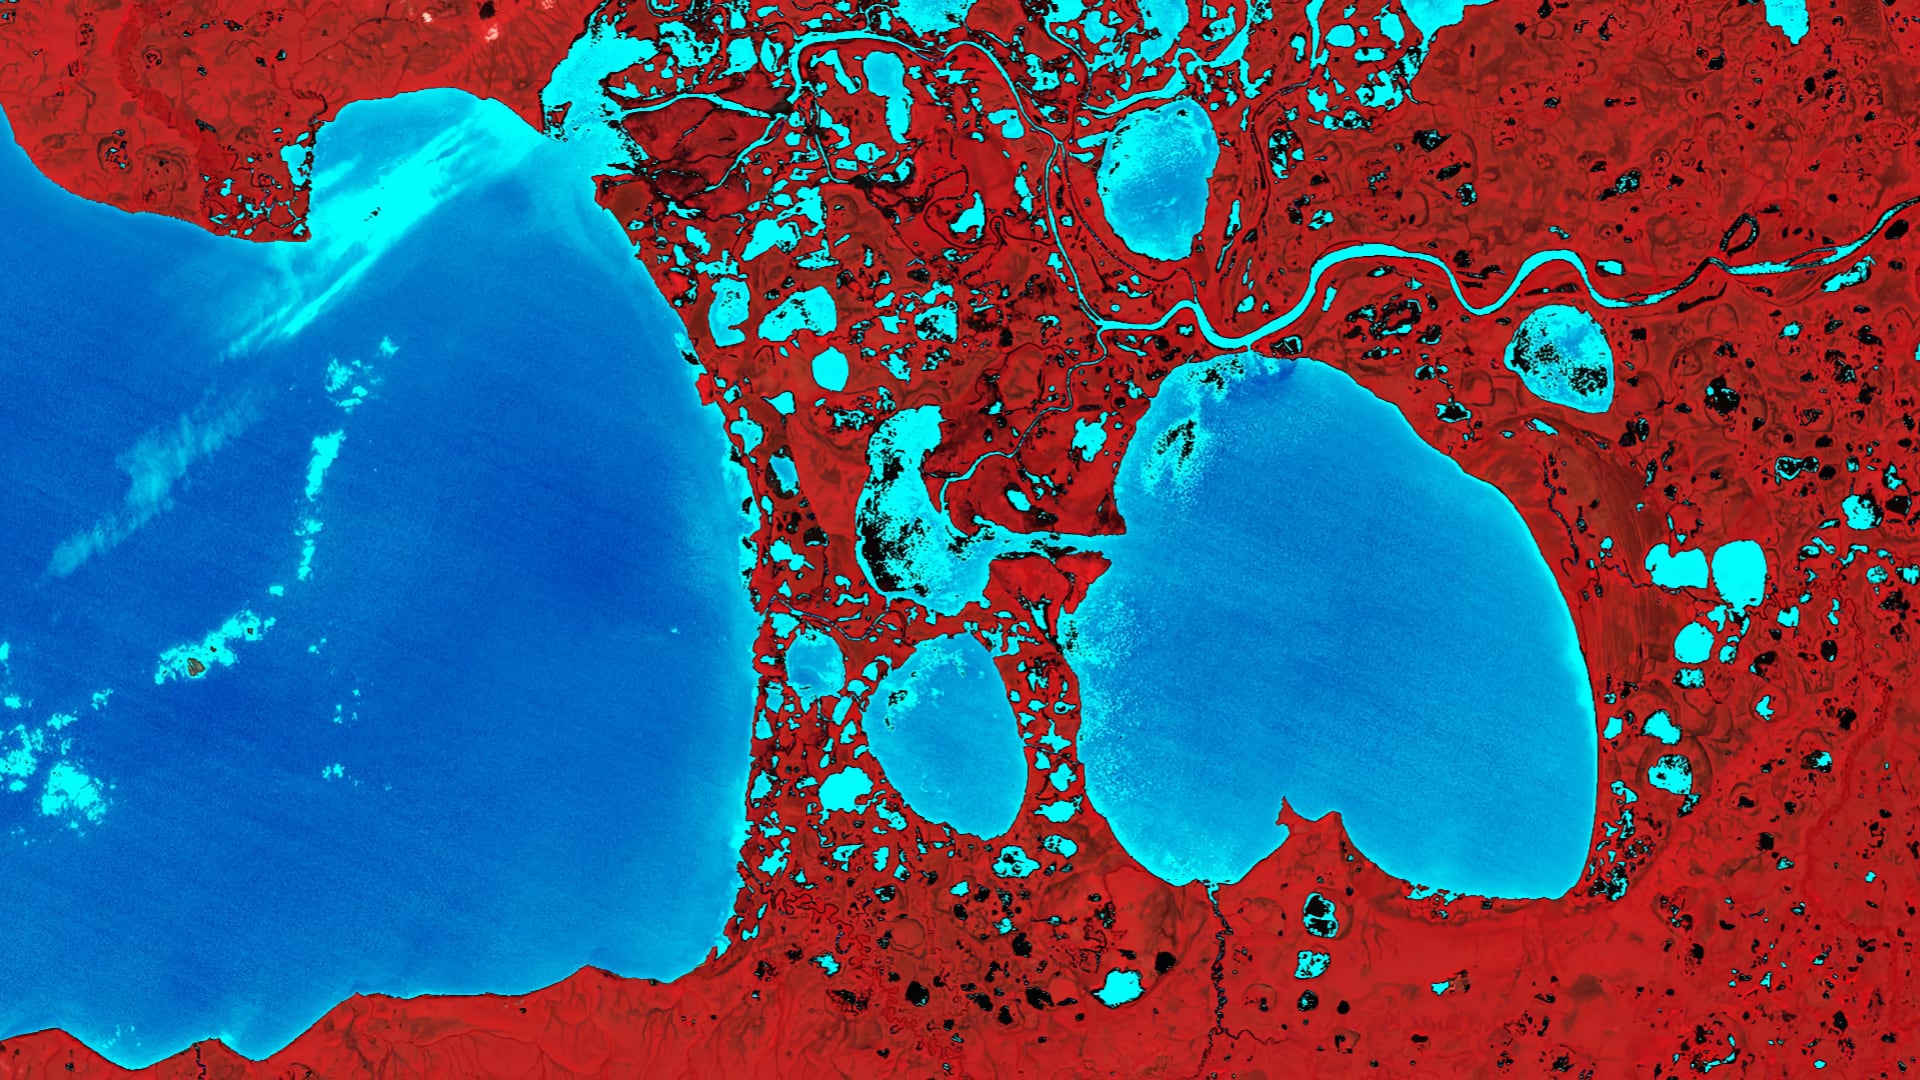
Alaska’s wetlands cover approximately one third of the state and provide a multitude of ecosystem services, including nutrient retention, water purification, and provision of habitat for fish, wildlife, and vegetation. The temporal variation in wetland inundation affects these ecosystem functions, and for effective wetland policy...
Erika Munshi
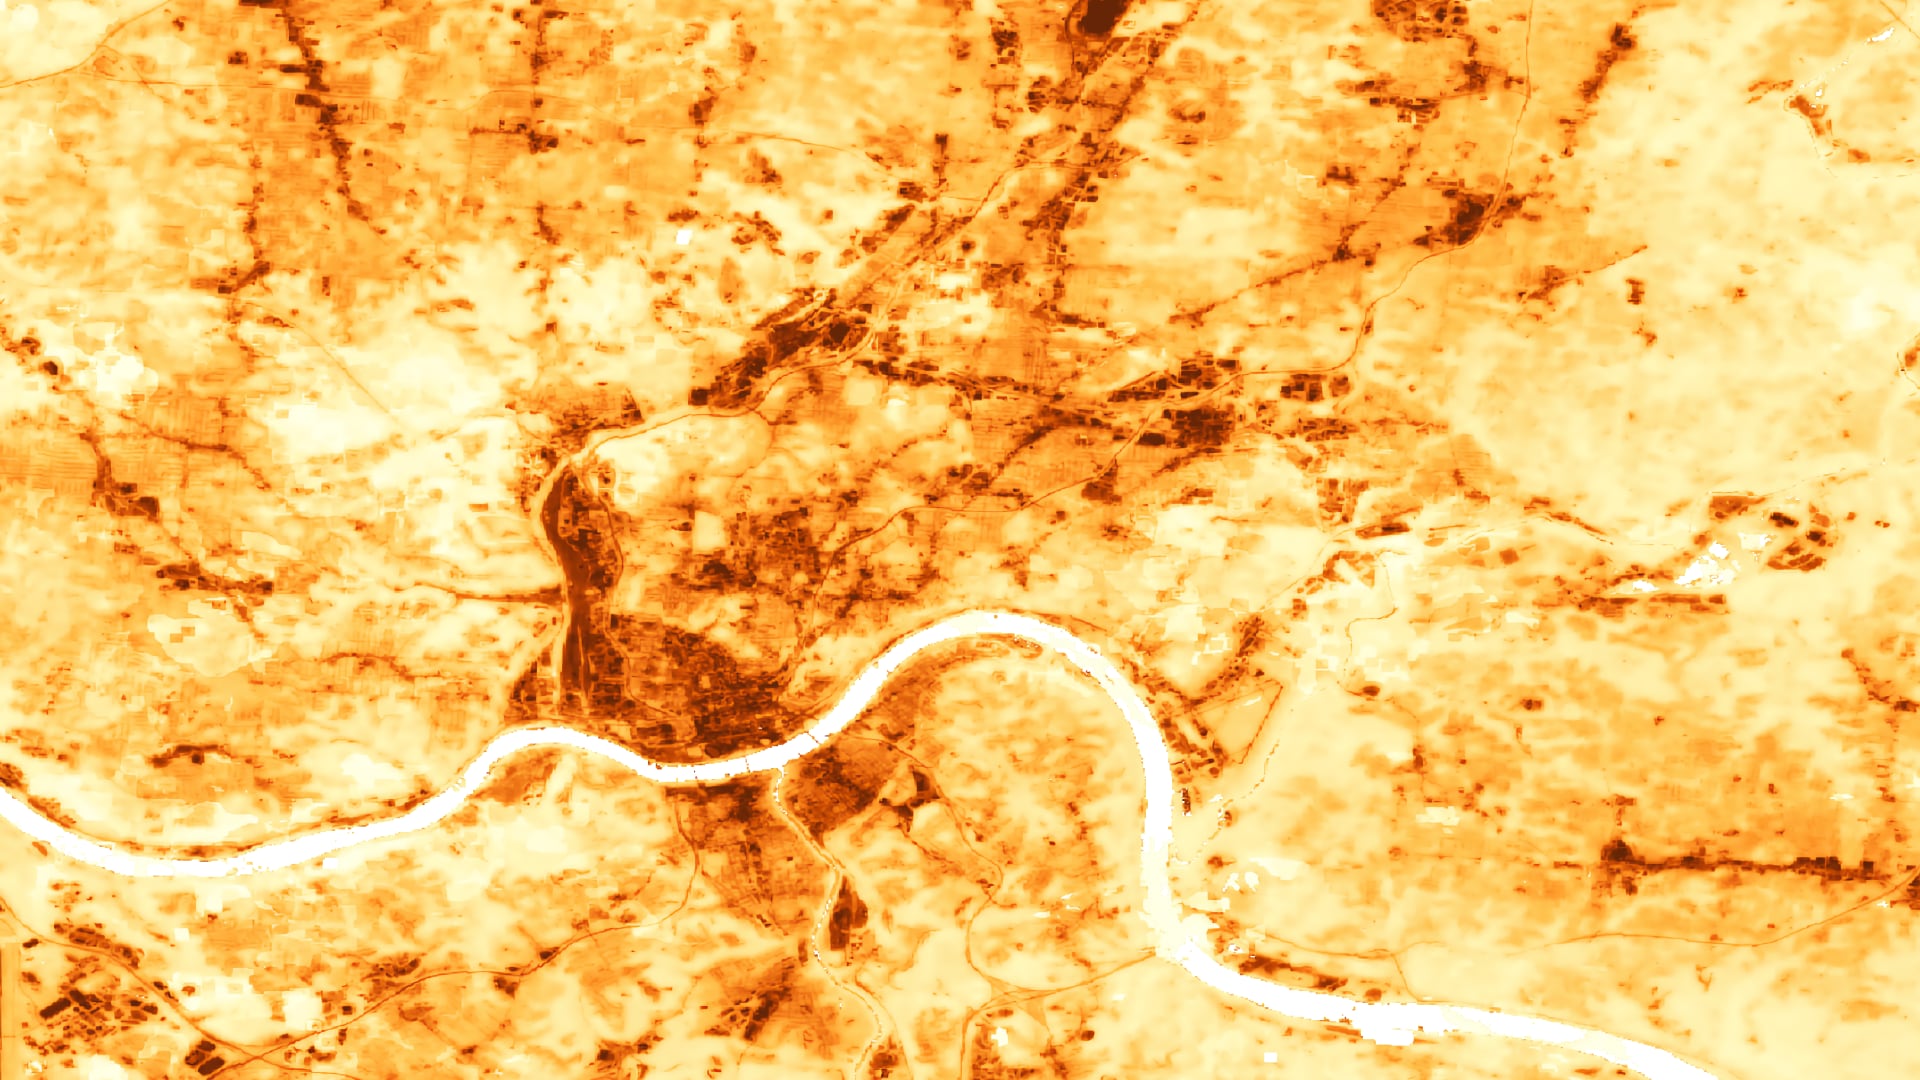
As flood events in the United States grow in frequency and intensity, the uses of applied remote sensing analyses are increasingly necessary for effective flood monitoring and warning systems. The NASA DEVELOP Ellicott City Disasters III project investigated the use...
M. Colin Marvin
Assateague Island is located off the coast of Maryland and Virginia and serves as a home to sensitive species and habitats. However, infrastructure development disrupted the natural sediment transport processes of the barrier island, which accelerated erosion of the island’s...
Brandon Crawford
Wildfire is a key driver of ecosystem progression in the sagebrush steppe-dominated landscapes of southern Idaho. Fire-related disturbances can facilitate the propagation of invasive vegetation, threatening native wildlife and shaping a fire regime that is increasingly hazardous to adjacent urban development. Applying the methodology created...