Displaying 401 - 410 of 473
![Aph(433)-processed imagery from merged Aqua MODIS and Sentinel-3 data. This image of the Gulf of Maine was taken on September 12, 2016 during one of the most severe harmful algal bloom events. Using in-situ data, it was determined that Pseudo-nitzschia was a dominant genus of algae present at the time of the bloom. Shades of bright green indicate peak absorption by phytoplankton and aph(433) is corrected for false positive absorption indications.](/sites/default/files/styles/lis/public/2023-02/2022Fall_MA_GulfofMaineWater_WebsiteImage.jpg.webp?itok=CezSF3AF)
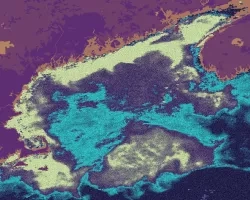
Gulf of Maine Water Resources (Fall 2022) Team: Suhani Dalal (Project Lead), Lily Gray, Yixuan Li, Jane Zugarek Summary: The Gulf of Maine has a...
![Stormwater retention across Wyandotte County, Kansas. NASA GPM IMERG data for September 2020 – August 2021 and NLCD 2019 Land Cover data were used as model inputs for the InVEST Stormwater Retention Model. One model output included a stormwater retention ratio layer where darker purple values indicate poor stormwater retention and increased flood risk. Areas of poor stormwater retention can then be identified as priority regions for Green Infrastructure initiatives in Wyandotte County.](/sites/default/files/styles/lis/public/2023-02/2022Fall_MA_KansasCityDisastersII_WebsiteImage.png.webp?itok=sqRBpysQ)
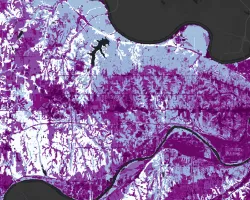
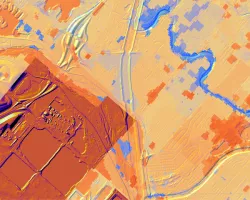
Kansas City Disasters II (Fall 2022) Team: Nora Carmody (Project Lead), Dain Kim, Kameron Lloyd, Ruby Nagelberg Summary: In pluvial flood events, stormwater runoff can...
![Forest/non-forest classification from 2022 Landsat 9 OLI-2 -derived imagery provided by NASA SERVIR. This image is of Volcan Baru in Panama. Green represents forest and blue represents agriculture and bare land. Yellow represents shrub, urban, wetland, plateaus, savanna, pastures, and pine. This forest/non-forest classification covers the entirety of the Mesoamerican Biological Corridor which provides valuable regional information to our partners.](/sites/default/files/styles/lis/public/2023-02/2022Fall_MSFC_MesoamericaEcoForecasting_WebsiteImage.jpg.webp?itok=hpxlOp_J)
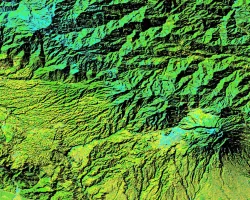
Mesoamerica Ecological Forecasting (Fall 2022) Team: Hanna Jung (Deliverables Lead), Ross Kalter (Technical Lead), Ameilia Untiedt, Cristina Villalobos-Heredia Summary: In 1992, Central America and Mexico...
![Urban extent derived from Landsat 8 OLI data. This image shows urban extent in Guatemala City in 2020 as calculated using the Landtrendr algorithm in Google Earth Engine. The lighter colors of yellow and orange depict urban area, and the darker shades of pink and purple indicate the natural environment. Guatemala City has experienced rapid growth in recent decades, and local decision makers are interested in its impacts on various social and environmental factors.](/sites/default/files/styles/lis/public/2023-02/2022Fall_MSFC_Guatemala%26PanamaUrban_WebsiteImage.jpg.webp?itok=BNkWD8K5)
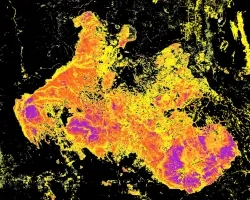
Guatemala & Panama Urban Development (Fall 2022) Team: Jennifer Ruiz (Project Lead), Coral Del Mar Valle Rodríguez; Viviana Lademan; Aaron Whittemore Summary: Central America is...
![Normalized burn ratio calculated from Landsat 8 imagery both preceding and following the Bootleg Wildfire in the Beatty, Oregon area. The fire burned from July 6th to August 15th during the Summer of 2021 and its footprint shows varying levels of burn severity. Dark purple areas indicate highest severity, shades of red and orange indicate moderate severity, and yellow areas indicate low burn severity. Black areas depict unburned areas.](/sites/default/files/styles/lis/public/2023-02/2022Fall_NC_Gatlinburg%26BeattyWildfires_WebsiteImage.jpeg.webp?itok=_JPQMuhI)
Gatlinburg & Beatty Wildfires (Fall 2022) Team: Kelli Roberts (Project Lead), William Hadley, Daniel Littleton Summary: Wildfire potential monitoring, which is increasingly vital under climate...
![Landsat 8 OLI data processed into the median NDVI for 2016-2021 with an overlay showing deforestation that occurred during this time period in the Talladega National Forest. The deforestation layer is derived from Global Forest Watch's forest cover data, which uses the Landsat series, and was calculated as the difference between forested areas in 2016 and forested areas in 2021. Shades of green indicate the density of forest, while red areas indicate areas deforested in 2021.](/sites/default/files/styles/lis/public/2023-02/2022Fall_PUP_SoutheastUSClimate_WebsiteImage.jpeg.webp?itok=9thA-LxI)
Topic
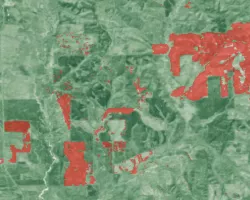
Southeast US Climate (Fall 2022) Team: Heidi Rogers (Project Lead), Mistaya Smith, Maggie Mason, Anish Holla Summary: Deforestation, a significant contributor to carbon emissions, is...
![This image of Land Surface Temperature (LST) illustrates the urban heat island (UHI) effect that Milwaukee County experiences. Light orange areas represent hotter temperatures, which are concentrated in the high impervious areas of the city. Darker pinks represent cooler rural areas and underscore the temperature contrast across the landscape. The hotter areas of the city are historically redlined communities of color that disproportionately feel the effects of the UHI, including higher energy bills heat re](/sites/default/files/styles/lis/public/2023-02/2022Fall_VEJ_MilwaukeeUrbanII_WebsiteImage.png.webp?itok=fmSKISME)
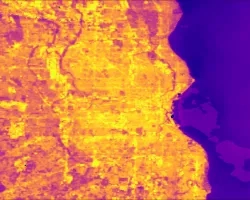
Milwaukee Urban Development II (Fall 2022) Team: Nash Keyes (Project Lead), caleigh McLaren, Nati Phan, Dalia Vazques Summary: Milwaukee’s neighborhoods experience increased social, health, and...
![Daytime land surface temperature for Wichita, Kansas summer 2017-2022, retrieved through Landsat 8 TIRS and Landsat 9 TIRS-2 surface temperature. Located in the northwest corner of the city, this image depicts higher temperatures through dark orange hues in developed areas, and lighter orange hues to blue colors where the temperature is lower. The land surface temperature was utilized to construct a heat vulnerability index for the city, looking into disproportionate impacts on underserved communities.](/sites/default/files/styles/lis/public/2023-02/2022Fall_VEJ_WichitaClimateII_WebsiteImage.png.webp?itok=oO4F6bs4)
Topic
Wichita Climate II (Fall 2022) Team: Ritisha Ghosh (Project Lead), Richard Kirschner, Ria Mukherjee, Raina Monaghan Summary: Wichita, Kansas is experiencing a host of climate...
![Eastern region of the Baa Atoll in the Republic of Maldives. The red indicates areas that would likely be flooded by 2100 according to the most extreme IPCC AR6 Shared Socioeconomic Pathway scenario, as identified through the NASA Sea Level Projection Tool. CoastalDEM, derived from NASA's SRTM sensor, provided elevation data. The base map image was taken in January 2023 by Planet Labs. Shades of yellow and green indicate shallow water and land surfaces. Includes copyrighted material of Planet Labs PBC. All](/sites/default/files/styles/lis/public/2023-04/2023Spring_ARC_MaldivesClimateII_WebsiteImage.jpg.webp?itok=U9qoVeWo)
Topic
Maldives Climate II (Spring 2023) Team: Ben Dahan (Project Lead), Evan Barrett, Tiffany Hsu, Gabriel Halaweh Summary: The Republic of the Maldives is a low-lying...
![Evaporative Stress Index (ESI) processed imagery from ECOSTRESS data, captured on October 4, 2021, for Marin County in the San Francisco Bay Area. Darker regions have a higher ESI value, signifying moister conditions, while lighter regions are drier. Vegetative moisture has a significant impact on fire severity and understanding localized moisture conditions can inform the county’s fire suppression efforts. Land outside of Marin County shows NDVI processed imagery derived from Sentinal-2A data.](/sites/default/files/styles/lis/public/2023-05/2023Spring_ARC_MarinCountyWildfires_WebsiteImage.png.webp?itok=FQS2THAF)
Topic
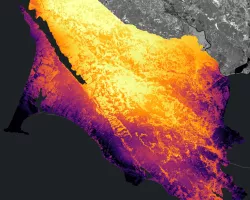
Marin County Wildland Fires (2023 Spring) Team: Suhani Dalal (Project Lead), Katera Lee, Chandler Ross, Gabriel Rosenstein Summary: Heightened occurrence of severe wildfires in the...