Displaying 71 - 80 of 101
![NDVI over Mato Grosso, Brazil processed from March 2021 Landsat-8 OLI data. Calculated NDVI values correspond with colors shown to indicate plant health. High NDVI values (green to blue) indicate dense vegetation found in tropical and temperate forests or crops at their peak growth. Low values (yellow to red) depict barren land, water, and moisture-stressed vegetation. These data can support timely and efficient agricultural responses to ensure productive yields and food security.](/sites/default/files/styles/lis/public/2022-12/2022Sum_NC_MatoGrosso_WebsiteImage_FD.png.webp?itok=JJA3kKJi)
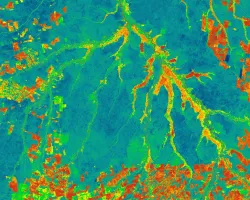
Mato Grosso Agriculture (Summer 2022) Team: Max Rock (Project Lead), Elijah Dalton, Aidan Harvey, Kate Reynolds Summary: Ranked as the fourth largest food producer in...
![This image of the Chesapeake Bay is derived from NASA Landsat 7 ETM+ and Landsat 8 OLI imagery. It represents median Normalized Difference Turbidity Index (NDTI) turbidity levels from January 2020 through June 2022. Yellow and orange areas indicate higher turbidity levels. This imagery can be used to determine areas of the bay in which turbidity poses a threat to water quality.](/sites/default/files/styles/lis/public/2022-12/2022Sum_PUP_ChesapeakeBayWater_WebsiteImage.png.webp?itok=tBWfMYEk)
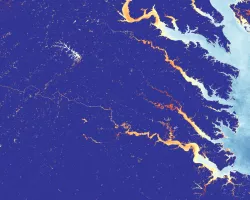
Chesapeake Bay Water Resources (Summer 2022) Team: Katherine Hahn, Julia Atayi, Julia Portmann, Abigail Sgan Summary: An increase in total suspended sediment (TSS) concentrations and...
![Median daily evapotranspiration (ET) from September 2021 to May 2022 calculated from ISS ECOSTRESS data. The image covers the agricultural fields adjacent to the Maipo River, Chile and depicts water stress. The color scale ranges from red (low ET) to blue (high ET), with higher ET observed over irrigated agricultural fields. ET is used for estimating crop irrigation requirements. This data will inform irrigation management practices and help alleviate water scarcity within the area. ](/sites/default/files/styles/lis/public/2023-01/2022Sum_ID_IdahoWildfires_WebsiteImage.jpg.webp?itok=MgV2NTHF)
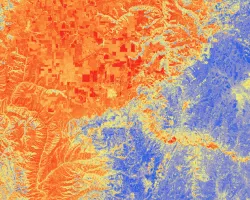
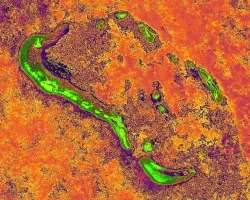
IDAHO WILDFIRES (Summer 2022) Team: Ford Freyberg (Project Lead), Carson Schuetze, Jessica Hiatt, Brenner Burkholder Summary: Escalating severity and frequency of drought and wildfire call...
![Normalized difference vegetation index (NDVI) generated from an October 5, 2021 Landsat 8 OLI image of Yellowstone National Park. The dark green shades represent areas with healthy vegetation, yellow depicts bare ground, and intermediate shades reflect a gradient of vegetation productivity. Areas with NDVI values that vary throughout the year are indicative of deciduous vegetation and can help resource managers understand changes in aspen stand extent.](/sites/default/files/styles/lis/public/2023-02/2022Fall_GA_YellowstoneEcoII_WebsiteImage.jpg.webp?itok=9zItKz9L)
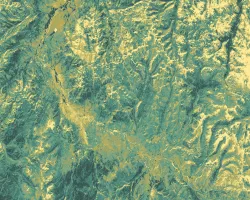
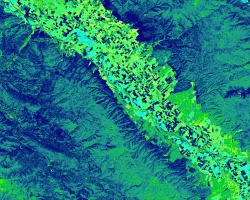
Yellowstone Ecological Forecasting II (Fall 2022) Team: Vanessa Bailey (Project Lead), Ryan Brinton, Samantha Snowden, Aliza White Summary: Aspen stands in Yellowstone National Park have...
![NDTI-processed river imagery from 2021 PlanetScope data with GPM IMERG data shown in blue. The Shoshone River in northwestern Wyoming is shown with red values indicating lower turbidity and yellow values representing higher turbidity. Lighter blue values indicate higher monthly mean IMERG precipitation values for 2021. NDTI values and precipitation averages help watershed managers understand where and when excess sediment enters the river.](/sites/default/files/styles/lis/public/2023-02/2022Fall_PUP_ShoshoneRiverWater_WebsiteImage.jpg.webp?itok=myaPr9UA)
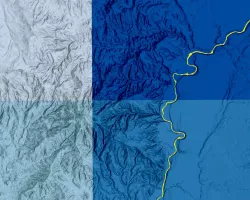
Shoshone River Water Resources (Fall 2022) Team: Robyn Holmes (Project Lead), Will Campbell, Cassie Ferrante, Nelson Lemnyuy Summary: In 2016, a routine repair operation at...
![Fall 2022 Maldives Climate](/sites/default/files/styles/lis/public/2023-02/2022Fall_ARC_MaldivesClimate_WebsiteImage.jpg.webp?itok=6Go_gwk1)
Topic
Maldives Climate (Fall 2022) Team: Aidan Harvey (Project Lead), Daniel Lopez, Mitch Porter, Derek Chin Summary: Global sea level rise as a result of climate...
![Land cover imagery processed from Landsat 8 OLI and ocean turbidity data imagery processed from Sentinel-2 MSI. The Tijuana River stormwater plume off the San Diego coast was mapped from data collected on December 5th, 2019, while the land surface data was collected on April 4th, 2022. Shades of red indicate high turbidity values, while blue areas show normal turbidity values. Areas of high turbidity reflect high concentration of pollutants from stormwater runoff.](/sites/default/files/styles/lis/public/2023-02/2022Fall_ARC_SanDiegoWaterResources_WebsiteImage.jpg.webp?itok=Z3fy2AmA)
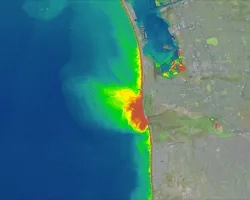
San Diego Water Resources (FALL 2022) Team: Ethan Gates (Project Lead), Stefanie Mendoza, Jonathan Szeto, Max VanArnam Summary: Stormwater and wastewater runoff are a large...
![NDVI imagery derived from Landsat 8 OLI data. This imagery showing the California’s Carmel and Salinas Valleys within the surrounding Santa Lucia Mountain range was collected in the Spring of 2019 . Light green areas show the more developed, agriculturally intensive areas of the valley while the dark blue areas show the less developed hills. NDVI calculations were used in models of forest cover changes in the area over time.](/sites/default/files/styles/lis/public/2023-02/2022Fall_CO_CarmelValleyEcoForecasting_WebsiteImage.jpg.webp?itok=AwlUPU2s)
Carmel Valley Urban Development (Fall 2022) Team: Cooper Campbell (Project Lead), Julia Portmann, Devina Garcia, Audrey Wilson Summary: Urban expansion in diverse ecosystems has numerous...
![Annual max biomass calculated from 2021 daily Harmonized LandSat Sentinel-2 (HLS) dataset. Dark purple colors show low biomass while the bright orange show high biomass. Regions with high vegetation and tree canopy cover are shown in orange on the left of the image. High biomass values are of an interest to rangeland managers to help inform their grazing decisions based on which areas of the ranch produce the most biomass/vegetation.](/sites/default/files/styles/lis/public/2023-02/2022Fall_CO_EasternPlainsAgr_WebsiteImage.jpg.webp?itok=StO3rYYa)
Eastern Plains Agriculture (Fall 2022) Team: Jillian Joubert, Sarah Hettema, Deni Ranguelova, TR Ingram, Max Stewart Summary: Adaptive management on cattle ranches requires rangeland managers...
![NDWI-processed imagery from Landsat 8 Operational Land Imager data. This mosaicked image was taken from January to December 2021 of Jekyll Island, Georgia. NDWI contrasts the water features in a satellite image to its surroundings by measuring the moisture content. Low moisture content is shown in white, and high moisture content is shown in blue.](/sites/default/files/styles/lis/public/2023-02/2022Fall_GA_Disasters_WebsiteImage.png.webp?itok=_4Frkxe1)
Georgia Disasters (Fall 2022) Team: Isabella Chittumuri (Project Lead), Nancee Uniyal, Nathan Tesfayi, Shakirah Rogers Summary: In September 2017, Hurricane Irma made landfall in southern...